Finnish vs Immigrants from Kuwait 8th Grade
COMPARE
Finnish
Immigrants from Kuwait
8th Grade
8th Grade Comparison
Finns
Immigrants from Kuwait
98.4%
8TH GRADE
100.0/ 100
METRIC RATING
3rd/ 347
METRIC RANK
96.1%
8TH GRADE
92.2/ 100
METRIC RATING
132nd/ 347
METRIC RANK
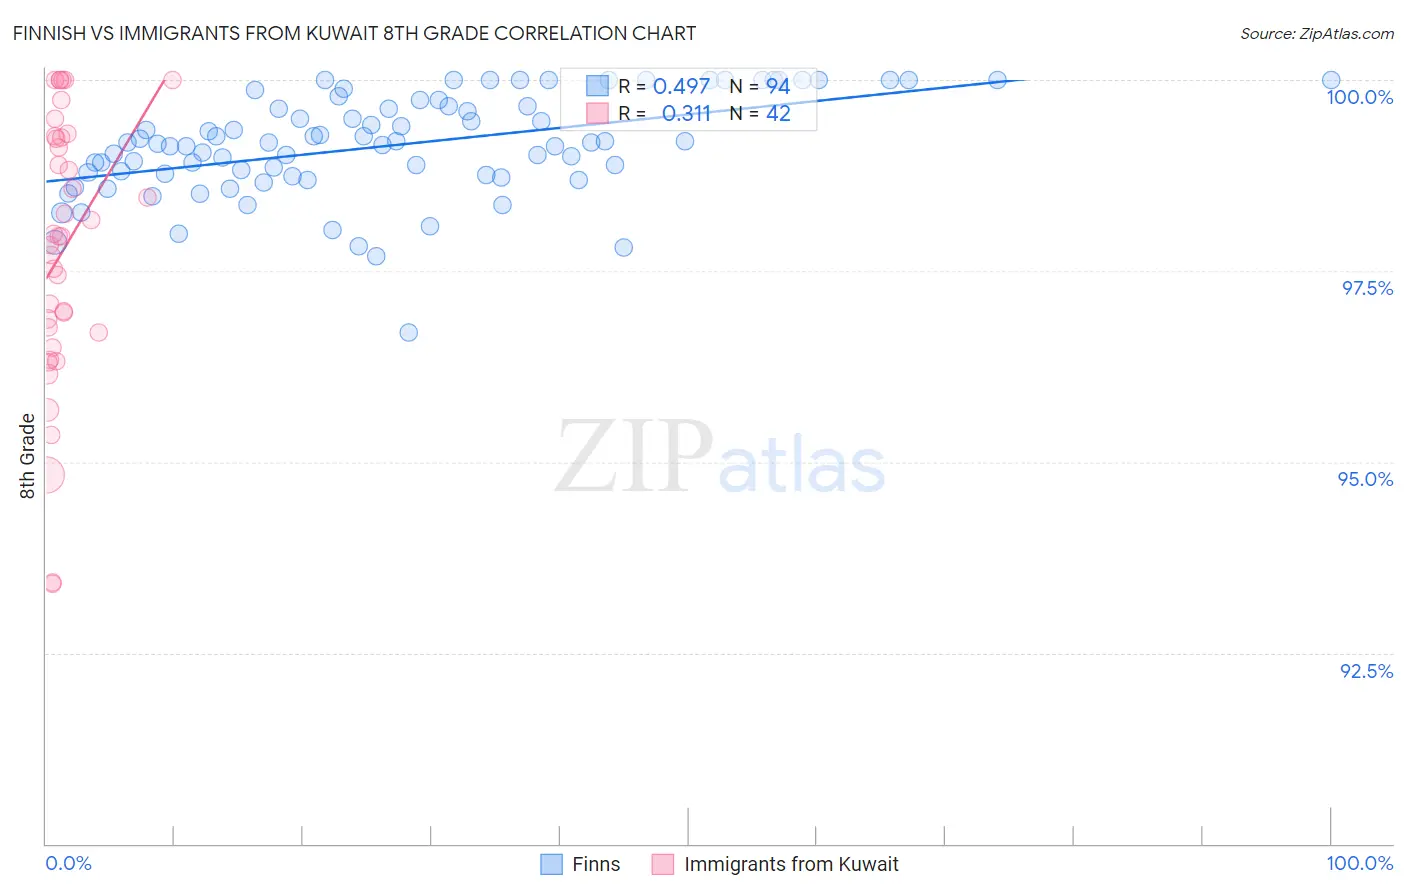
Finnish vs Immigrants from Kuwait 8th Grade Correlation Chart
The statistical analysis conducted on geographies consisting of 46,910,222 people shows a moderate positive correlation between the proportion of Finns and percentage of population with at least 8th grade education in the United States with a correlation coefficient (R) of 0.497 and weighted average of 98.4%. Similarly, the statistical analysis conducted on geographies consisting of 136,913,666 people shows a mild positive correlation between the proportion of Immigrants from Kuwait and percentage of population with at least 8th grade education in the United States with a correlation coefficient (R) of 0.311 and weighted average of 96.1%, a difference of 2.4%.
8th Grade Correlation Summary
| Measurement | Finnish | Immigrants from Kuwait |
| Minimum | 96.7% | 93.4% |
| Maximum | 100.0% | 100.0% |
| Range | 3.3% | 6.6% |
| Mean | 99.1% | 97.8% |
| Median | 99.2% | 98.0% |
| Interquartile 25% (IQ1) | 98.8% | 96.7% |
| Interquartile 75% (IQ3) | 99.7% | 99.2% |
| Interquartile Range (IQR) | 0.90% | 2.6% |
| Standard Deviation (Sample) | 0.67% | 1.7% |
| Standard Deviation (Population) | 0.66% | 1.7% |
Similar Demographics by 8th Grade
Demographics Similar to Finns by 8th Grade
In terms of 8th grade, the demographic groups most similar to Finns are Carpatho Rusyn (98.1%, a difference of 0.23%), Ottawa (97.9%, a difference of 0.43%), Tsimshian (99.0%, a difference of 0.60%), Crow (99.0%, a difference of 0.69%), and Dutch (97.7%, a difference of 0.72%).
| Demographics | Rating | Rank | 8th Grade |
| Crow | 100.0 /100 | #1 | Exceptional 99.0% |
| Tsimshian | 100.0 /100 | #2 | Exceptional 99.0% |
| Finns | 100.0 /100 | #3 | Exceptional 98.4% |
| Carpatho Rusyns | 100.0 /100 | #4 | Exceptional 98.1% |
| Ottawa | 100.0 /100 | #5 | Exceptional 97.9% |
| Dutch | 100.0 /100 | #6 | Exceptional 97.7% |
| Norwegians | 100.0 /100 | #7 | Exceptional 97.6% |
| Slovaks | 100.0 /100 | #8 | Exceptional 97.6% |
| Germans | 100.0 /100 | #9 | Exceptional 97.5% |
| Slovenes | 100.0 /100 | #10 | Exceptional 97.5% |
| Poles | 100.0 /100 | #11 | Exceptional 97.4% |
| Swedes | 100.0 /100 | #12 | Exceptional 97.4% |
| Alaskan Athabascans | 100.0 /100 | #13 | Exceptional 97.3% |
| English | 100.0 /100 | #14 | Exceptional 97.3% |
| Pennsylvania Germans | 100.0 /100 | #15 | Exceptional 97.3% |
Demographics Similar to Immigrants from Kuwait by 8th Grade
In terms of 8th grade, the demographic groups most similar to Immigrants from Kuwait are Pueblo (96.1%, a difference of 0.0%), Soviet Union (96.1%, a difference of 0.010%), Immigrants from Turkey (96.1%, a difference of 0.010%), Immigrants from Hungary (96.1%, a difference of 0.010%), and Basque (96.1%, a difference of 0.010%).
| Demographics | Rating | Rank | 8th Grade |
| Immigrants | Romania | 94.1 /100 | #125 | Exceptional 96.2% |
| Choctaw | 94.0 /100 | #126 | Exceptional 96.2% |
| Immigrants | Serbia | 94.0 /100 | #127 | Exceptional 96.2% |
| Immigrants | Bosnia and Herzegovina | 93.9 /100 | #128 | Exceptional 96.2% |
| Cheyenne | 93.3 /100 | #129 | Exceptional 96.1% |
| Soviet Union | 92.6 /100 | #130 | Exceptional 96.1% |
| Pueblo | 92.3 /100 | #131 | Exceptional 96.1% |
| Immigrants | Kuwait | 92.2 /100 | #132 | Exceptional 96.1% |
| Immigrants | Turkey | 91.7 /100 | #133 | Exceptional 96.1% |
| Immigrants | Hungary | 91.5 /100 | #134 | Exceptional 96.1% |
| Basques | 91.5 /100 | #135 | Exceptional 96.1% |
| Jordanians | 91.3 /100 | #136 | Exceptional 96.1% |
| Cambodians | 90.6 /100 | #137 | Exceptional 96.1% |
| Burmese | 90.2 /100 | #138 | Exceptional 96.1% |
| Hmong | 89.7 /100 | #139 | Excellent 96.1% |