Immigrants from Burma/Myanmar vs Colville 1st Grade
COMPARE
Immigrants from Burma/Myanmar
Colville
1st Grade
1st Grade Comparison
Immigrants from Burma/Myanmar
Colville
96.8%
1ST GRADE
0.0/ 100
METRIC RATING
320th/ 347
METRIC RANK
98.2%
1ST GRADE
98.0/ 100
METRIC RATING
100th/ 347
METRIC RANK
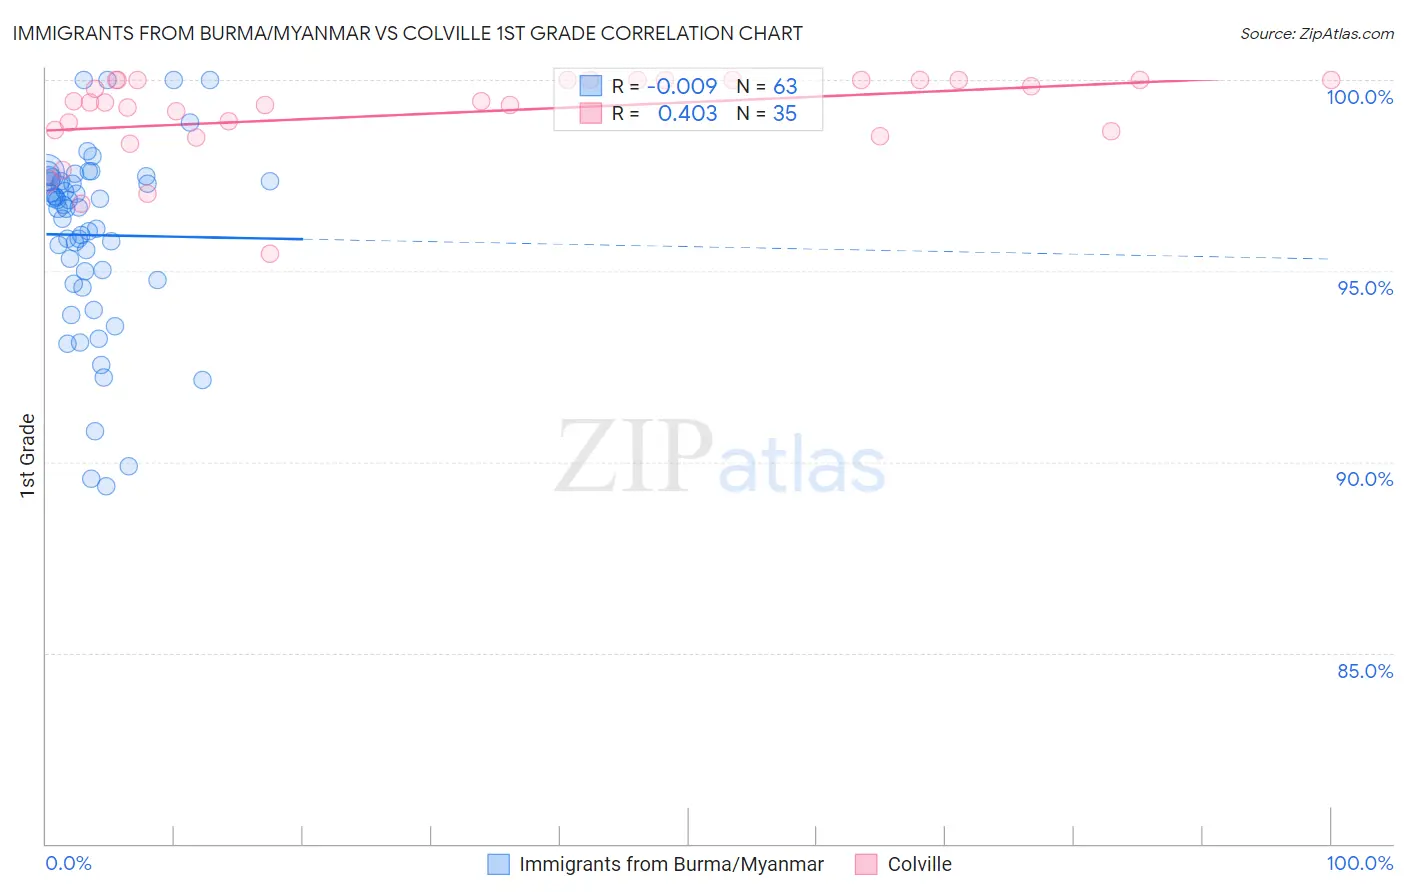
Immigrants from Burma/Myanmar vs Colville 1st Grade Correlation Chart
The statistical analysis conducted on geographies consisting of 172,338,093 people shows no correlation between the proportion of Immigrants from Burma/Myanmar and percentage of population with at least 1st grade education in the United States with a correlation coefficient (R) of -0.009 and weighted average of 96.8%. Similarly, the statistical analysis conducted on geographies consisting of 34,687,839 people shows a moderate positive correlation between the proportion of Colville and percentage of population with at least 1st grade education in the United States with a correlation coefficient (R) of 0.403 and weighted average of 98.2%, a difference of 1.5%.
1st Grade Correlation Summary
| Measurement | Immigrants from Burma/Myanmar | Colville |
| Minimum | 89.4% | 95.4% |
| Maximum | 100.0% | 100.0% |
| Range | 10.6% | 4.6% |
| Mean | 95.9% | 99.1% |
| Median | 96.6% | 99.4% |
| Interquartile 25% (IQ1) | 94.8% | 98.6% |
| Interquartile 75% (IQ3) | 97.4% | 100.0% |
| Interquartile Range (IQR) | 2.6% | 1.4% |
| Standard Deviation (Sample) | 2.4% | 1.1% |
| Standard Deviation (Population) | 2.4% | 1.1% |
Similar Demographics by 1st Grade
Demographics Similar to Immigrants from Burma/Myanmar by 1st Grade
In terms of 1st grade, the demographic groups most similar to Immigrants from Burma/Myanmar are Immigrants from Guyana (96.8%, a difference of 0.0%), Immigrants from Bangladesh (96.8%, a difference of 0.010%), Immigrants from Laos (96.8%, a difference of 0.020%), Mexican American Indian (96.8%, a difference of 0.020%), and Immigrants from Honduras (96.8%, a difference of 0.030%).
| Demographics | Rating | Rank | 1st Grade |
| Guyanese | 0.0 /100 | #313 | Tragic 96.9% |
| Hondurans | 0.0 /100 | #314 | Tragic 96.9% |
| Immigrants | Belize | 0.0 /100 | #315 | Tragic 96.9% |
| Immigrants | Ecuador | 0.0 /100 | #316 | Tragic 96.9% |
| Immigrants | Nicaragua | 0.0 /100 | #317 | Tragic 96.9% |
| Immigrants | Laos | 0.0 /100 | #318 | Tragic 96.8% |
| Immigrants | Guyana | 0.0 /100 | #319 | Tragic 96.8% |
| Immigrants | Burma/Myanmar | 0.0 /100 | #320 | Tragic 96.8% |
| Immigrants | Bangladesh | 0.0 /100 | #321 | Tragic 96.8% |
| Mexican American Indians | 0.0 /100 | #322 | Tragic 96.8% |
| Immigrants | Honduras | 0.0 /100 | #323 | Tragic 96.8% |
| Vietnamese | 0.0 /100 | #324 | Tragic 96.8% |
| Dominicans | 0.0 /100 | #325 | Tragic 96.7% |
| Indonesians | 0.0 /100 | #326 | Tragic 96.7% |
| Mexicans | 0.0 /100 | #327 | Tragic 96.7% |
Demographics Similar to Colville by 1st Grade
In terms of 1st grade, the demographic groups most similar to Colville are Cypriot (98.2%, a difference of 0.010%), Nonimmigrants (98.2%, a difference of 0.010%), Choctaw (98.2%, a difference of 0.010%), Puget Sound Salish (98.2%, a difference of 0.010%), and Romanian (98.2%, a difference of 0.010%).
| Demographics | Rating | Rank | 1st Grade |
| Immigrants | India | 98.6 /100 | #93 | Exceptional 98.2% |
| South Africans | 98.6 /100 | #94 | Exceptional 98.2% |
| Immigrants | Germany | 98.5 /100 | #95 | Exceptional 98.2% |
| Cypriots | 98.3 /100 | #96 | Exceptional 98.2% |
| Immigrants | Nonimmigrants | 98.3 /100 | #97 | Exceptional 98.2% |
| Choctaw | 98.3 /100 | #98 | Exceptional 98.2% |
| Puget Sound Salish | 98.2 /100 | #99 | Exceptional 98.2% |
| Colville | 98.0 /100 | #100 | Exceptional 98.2% |
| Romanians | 97.8 /100 | #101 | Exceptional 98.2% |
| Cree | 97.8 /100 | #102 | Exceptional 98.2% |
| Immigrants | Ireland | 97.7 /100 | #103 | Exceptional 98.2% |
| Pima | 97.5 /100 | #104 | Exceptional 98.2% |
| Basques | 97.4 /100 | #105 | Exceptional 98.2% |
| Turks | 97.4 /100 | #106 | Exceptional 98.2% |
| Immigrants | Switzerland | 97.3 /100 | #107 | Exceptional 98.2% |