Immigrants from Romania vs Immigrants from Europe 7th Grade
COMPARE
Immigrants from Romania
Immigrants from Europe
7th Grade
7th Grade Comparison
Immigrants from Romania
Immigrants from Europe
96.4%
7TH GRADE
93.2/ 100
METRIC RATING
128th/ 347
METRIC RANK
96.5%
7TH GRADE
94.8/ 100
METRIC RATING
122nd/ 347
METRIC RANK
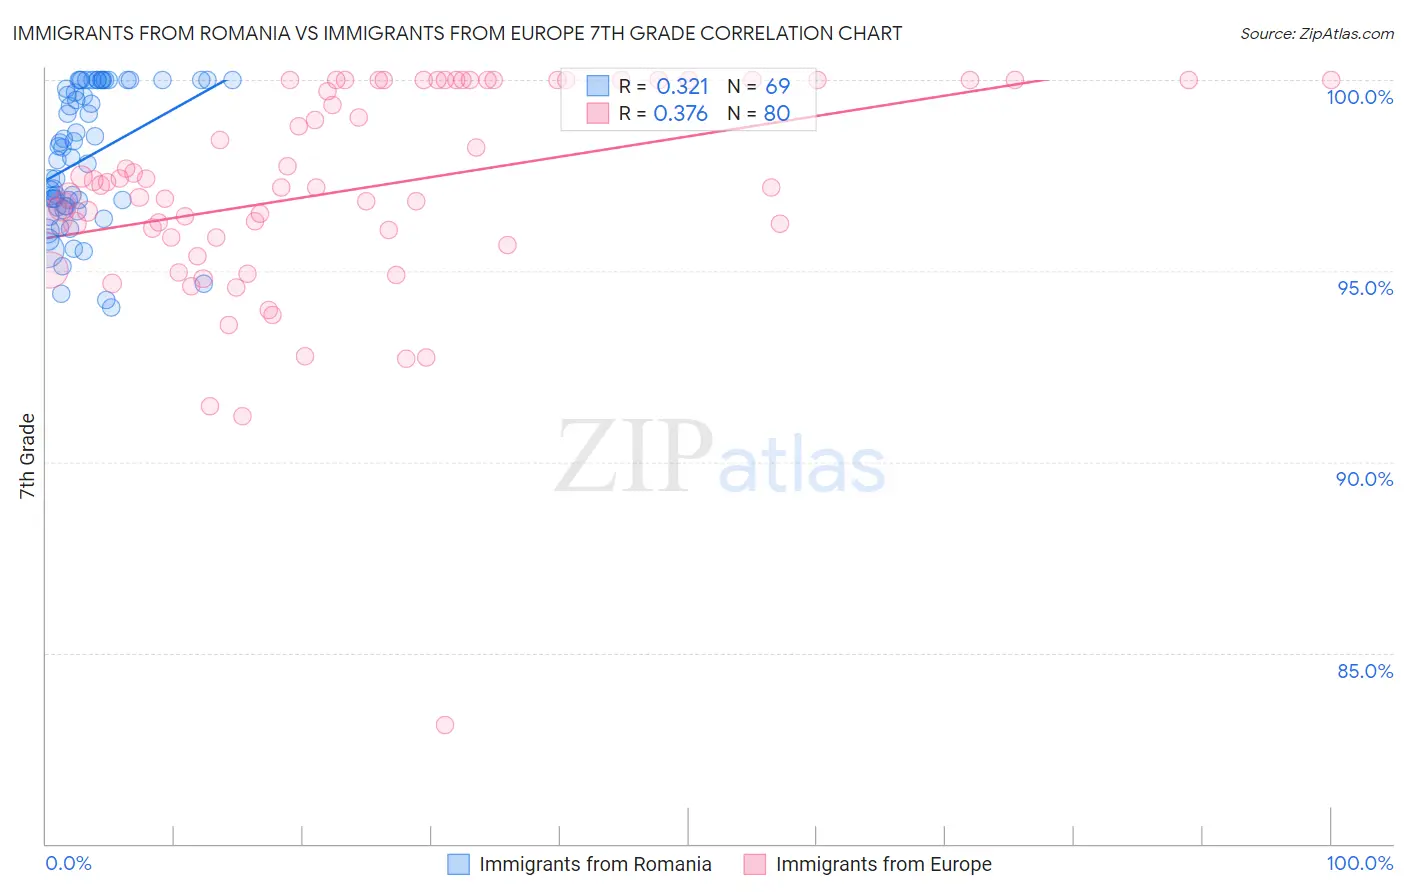
Immigrants from Romania vs Immigrants from Europe 7th Grade Correlation Chart
The statistical analysis conducted on geographies consisting of 257,008,799 people shows a mild positive correlation between the proportion of Immigrants from Romania and percentage of population with at least 7th grade education in the United States with a correlation coefficient (R) of 0.321 and weighted average of 96.4%. Similarly, the statistical analysis conducted on geographies consisting of 547,425,973 people shows a mild positive correlation between the proportion of Immigrants from Europe and percentage of population with at least 7th grade education in the United States with a correlation coefficient (R) of 0.376 and weighted average of 96.5%, a difference of 0.040%.
7th Grade Correlation Summary
| Measurement | Immigrants from Romania | Immigrants from Europe |
| Minimum | 94.0% | 83.1% |
| Maximum | 100.0% | 100.0% |
| Range | 6.0% | 16.9% |
| Mean | 97.9% | 97.2% |
| Median | 98.0% | 97.2% |
| Interquartile 25% (IQ1) | 96.7% | 95.9% |
| Interquartile 75% (IQ3) | 100.0% | 100.0% |
| Interquartile Range (IQR) | 3.3% | 4.1% |
| Standard Deviation (Sample) | 1.8% | 2.8% |
| Standard Deviation (Population) | 1.8% | 2.8% |
Demographics Similar to Immigrants from Romania and Immigrants from Europe by 7th Grade
In terms of 7th grade, the demographic groups most similar to Immigrants from Romania are Immigrants from Bosnia and Herzegovina (96.4%, a difference of 0.0%), Immigrants from North Macedonia (96.4%, a difference of 0.0%), Palestinian (96.4%, a difference of 0.010%), Immigrants from Serbia (96.4%, a difference of 0.010%), and Immigrants from Bulgaria (96.4%, a difference of 0.020%). Similarly, the demographic groups most similar to Immigrants from Europe are Cheyenne (96.5%, a difference of 0.0%), Immigrants from France (96.5%, a difference of 0.0%), Immigrants from Norway (96.5%, a difference of 0.010%), Immigrants from Croatia (96.5%, a difference of 0.010%), and Immigrants from Switzerland (96.5%, a difference of 0.010%).
| Demographics | Rating | Rank | 7th Grade |
| Choctaw | 96.6 /100 | #115 | Exceptional 96.5% |
| Syrians | 96.6 /100 | #116 | Exceptional 96.5% |
| Immigrants | Moldova | 95.7 /100 | #117 | Exceptional 96.5% |
| Immigrants | Japan | 95.5 /100 | #118 | Exceptional 96.5% |
| Immigrants | Norway | 95.2 /100 | #119 | Exceptional 96.5% |
| Immigrants | Croatia | 95.0 /100 | #120 | Exceptional 96.5% |
| Cheyenne | 94.9 /100 | #121 | Exceptional 96.5% |
| Immigrants | Europe | 94.8 /100 | #122 | Exceptional 96.5% |
| Immigrants | France | 94.7 /100 | #123 | Exceptional 96.5% |
| Immigrants | Switzerland | 94.5 /100 | #124 | Exceptional 96.5% |
| Immigrants | Bulgaria | 94.0 /100 | #125 | Exceptional 96.4% |
| Palestinians | 93.5 /100 | #126 | Exceptional 96.4% |
| Immigrants | Bosnia and Herzegovina | 93.3 /100 | #127 | Exceptional 96.4% |
| Immigrants | Romania | 93.2 /100 | #128 | Exceptional 96.4% |
| Immigrants | North Macedonia | 93.1 /100 | #129 | Exceptional 96.4% |
| Immigrants | Serbia | 92.8 /100 | #130 | Exceptional 96.4% |
| Filipinos | 92.1 /100 | #131 | Exceptional 96.4% |
| Colville | 91.7 /100 | #132 | Exceptional 96.4% |
| Hmong | 91.5 /100 | #133 | Exceptional 96.4% |
| Soviet Union | 91.2 /100 | #134 | Exceptional 96.4% |
| Immigrants | Kuwait | 91.1 /100 | #135 | Exceptional 96.4% |