Lumbee vs American 5th Grade
COMPARE
Lumbee
American
5th Grade
5th Grade Comparison
Lumbee
Americans
97.8%
5TH GRADE
99.3/ 100
METRIC RATING
74th/ 347
METRIC RANK
97.9%
5TH GRADE
99.7/ 100
METRIC RATING
59th/ 347
METRIC RANK
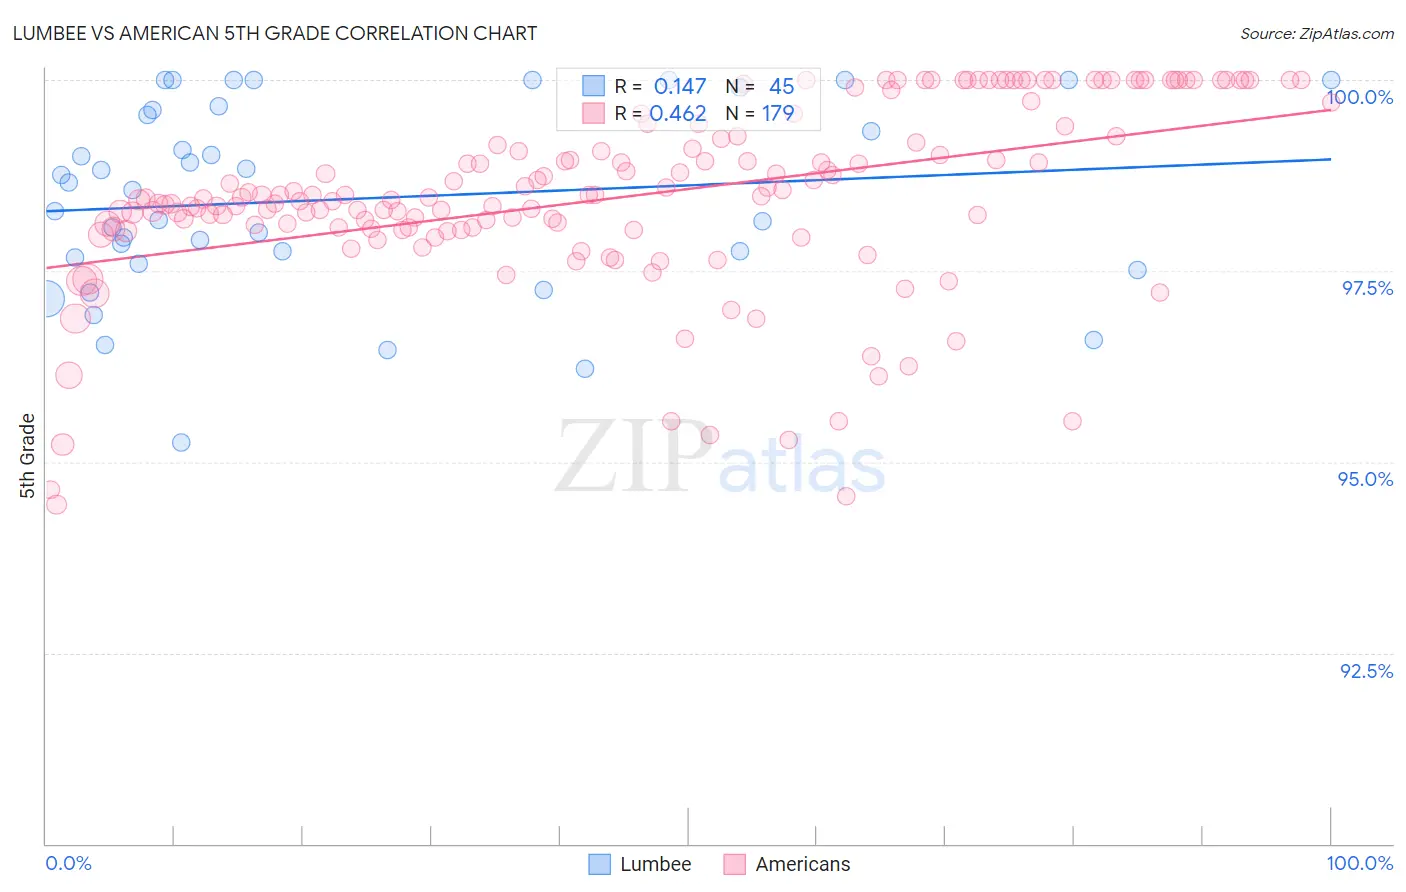
Lumbee vs American 5th Grade Correlation Chart
The statistical analysis conducted on geographies consisting of 92,298,549 people shows a poor positive correlation between the proportion of Lumbee and percentage of population with at least 5th grade education in the United States with a correlation coefficient (R) of 0.147 and weighted average of 97.8%. Similarly, the statistical analysis conducted on geographies consisting of 581,993,401 people shows a moderate positive correlation between the proportion of Americans and percentage of population with at least 5th grade education in the United States with a correlation coefficient (R) of 0.462 and weighted average of 97.9%, a difference of 0.10%.
5th Grade Correlation Summary
| Measurement | Lumbee | American |
| Minimum | 95.3% | 94.4% |
| Maximum | 100.0% | 100.0% |
| Range | 4.7% | 5.6% |
| Mean | 98.4% | 98.5% |
| Median | 98.6% | 98.5% |
| Interquartile 25% (IQ1) | 97.6% | 98.0% |
| Interquartile 75% (IQ3) | 99.6% | 99.3% |
| Interquartile Range (IQR) | 2.0% | 1.2% |
| Standard Deviation (Sample) | 1.2% | 1.2% |
| Standard Deviation (Population) | 1.2% | 1.2% |
Demographics Similar to Lumbee and Americans by 5th Grade
In terms of 5th grade, the demographic groups most similar to Lumbee are Cherokee (97.8%, a difference of 0.0%), Ukrainian (97.8%, a difference of 0.0%), Immigrants from Netherlands (97.8%, a difference of 0.0%), Chickasaw (97.9%, a difference of 0.020%), and Macedonian (97.9%, a difference of 0.020%). Similarly, the demographic groups most similar to Americans are Greek (97.9%, a difference of 0.010%), Austrian (97.9%, a difference of 0.010%), White/Caucasian (97.9%, a difference of 0.010%), Immigrants from Canada (97.9%, a difference of 0.010%), and Serbian (97.9%, a difference of 0.020%).
| Demographics | Rating | Rank | 5th Grade |
| Greeks | 99.8 /100 | #56 | Exceptional 97.9% |
| Austrians | 99.8 /100 | #57 | Exceptional 97.9% |
| Whites/Caucasians | 99.8 /100 | #58 | Exceptional 97.9% |
| Americans | 99.7 /100 | #59 | Exceptional 97.9% |
| Immigrants | Canada | 99.7 /100 | #60 | Exceptional 97.9% |
| Serbians | 99.7 /100 | #61 | Exceptional 97.9% |
| Immigrants | North America | 99.7 /100 | #62 | Exceptional 97.9% |
| Russians | 99.7 /100 | #63 | Exceptional 97.9% |
| Immigrants | Northern Europe | 99.6 /100 | #64 | Exceptional 97.9% |
| Canadians | 99.6 /100 | #65 | Exceptional 97.9% |
| Immigrants | Austria | 99.6 /100 | #66 | Exceptional 97.9% |
| New Zealanders | 99.6 /100 | #67 | Exceptional 97.9% |
| Cajuns | 99.6 /100 | #68 | Exceptional 97.9% |
| Kiowa | 99.5 /100 | #69 | Exceptional 97.9% |
| Iranians | 99.5 /100 | #70 | Exceptional 97.9% |
| Chickasaw | 99.5 /100 | #71 | Exceptional 97.9% |
| Macedonians | 99.4 /100 | #72 | Exceptional 97.9% |
| Cherokee | 99.4 /100 | #73 | Exceptional 97.8% |
| Lumbee | 99.3 /100 | #74 | Exceptional 97.8% |
| Ukrainians | 99.3 /100 | #75 | Exceptional 97.8% |
| Immigrants | Netherlands | 99.3 /100 | #76 | Exceptional 97.8% |