Immigrants from Portugal vs Immigrants from Cabo Verde 9th Grade
COMPARE
Immigrants from Portugal
Immigrants from Cabo Verde
9th Grade
9th Grade Comparison
Immigrants from Portugal
Immigrants from Cabo Verde
92.2%
9TH GRADE
0.0/ 100
METRIC RATING
314th/ 347
METRIC RANK
90.9%
9TH GRADE
0.0/ 100
METRIC RATING
330th/ 347
METRIC RANK
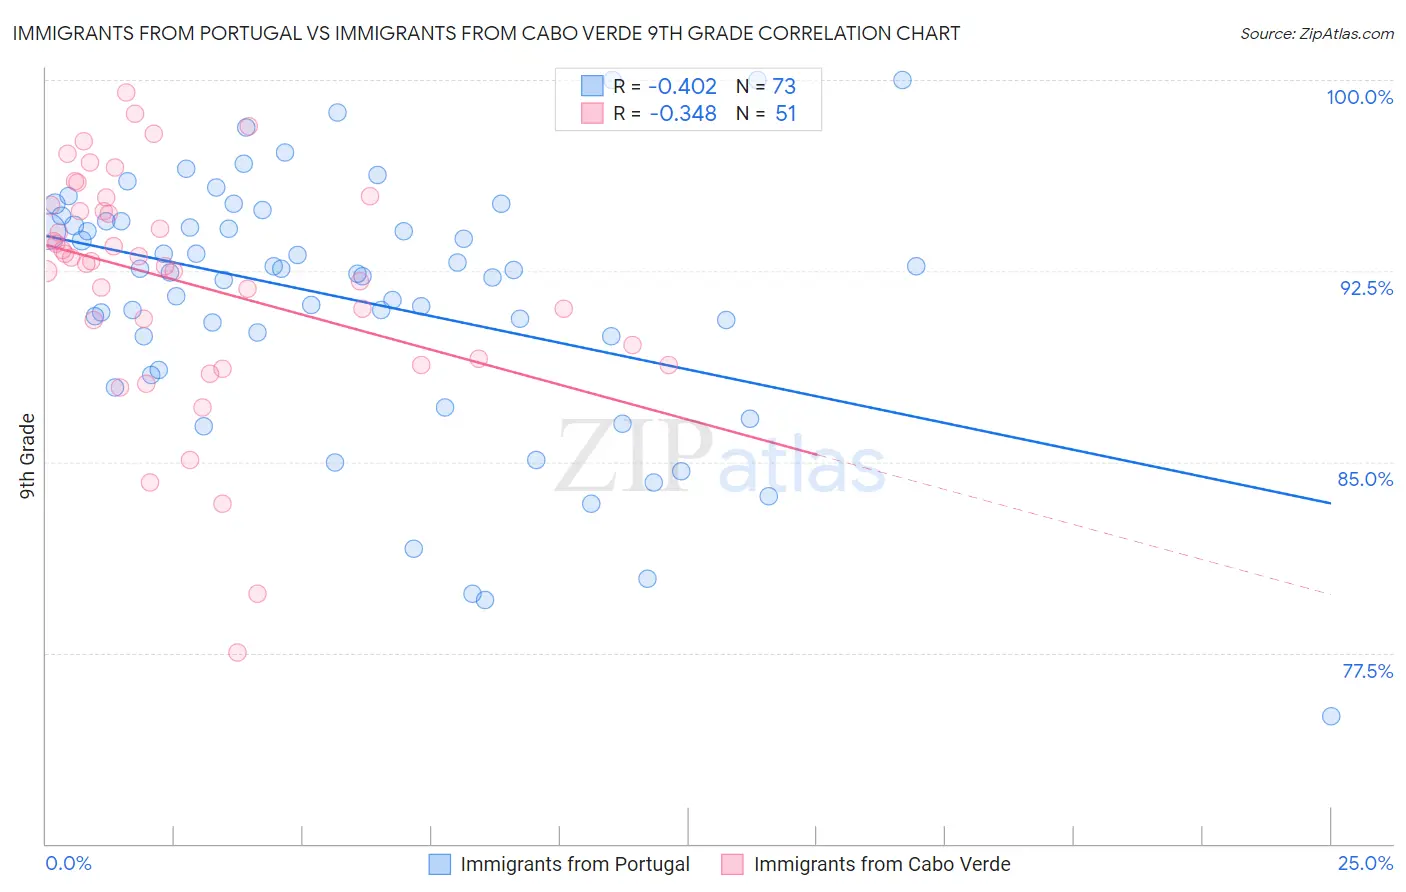
Immigrants from Portugal vs Immigrants from Cabo Verde 9th Grade Correlation Chart
The statistical analysis conducted on geographies consisting of 174,792,107 people shows a moderate negative correlation between the proportion of Immigrants from Portugal and percentage of population with at least 9th grade education in the United States with a correlation coefficient (R) of -0.402 and weighted average of 92.2%. Similarly, the statistical analysis conducted on geographies consisting of 38,158,316 people shows a mild negative correlation between the proportion of Immigrants from Cabo Verde and percentage of population with at least 9th grade education in the United States with a correlation coefficient (R) of -0.348 and weighted average of 90.9%, a difference of 1.5%.
9th Grade Correlation Summary
| Measurement | Immigrants from Portugal | Immigrants from Cabo Verde |
| Minimum | 75.0% | 77.5% |
| Maximum | 100.0% | 99.5% |
| Range | 25.0% | 22.0% |
| Mean | 91.3% | 92.1% |
| Median | 92.5% | 92.9% |
| Interquartile 25% (IQ1) | 89.3% | 89.1% |
| Interquartile 75% (IQ3) | 94.5% | 95.1% |
| Interquartile Range (IQR) | 5.2% | 6.0% |
| Standard Deviation (Sample) | 5.1% | 4.6% |
| Standard Deviation (Population) | 5.0% | 4.5% |
Demographics Similar to Immigrants from Portugal and Immigrants from Cabo Verde by 9th Grade
In terms of 9th grade, the demographic groups most similar to Immigrants from Portugal are Immigrants from Caribbean (92.2%, a difference of 0.010%), Vietnamese (92.3%, a difference of 0.040%), Cape Verdean (92.2%, a difference of 0.050%), Houma (92.3%, a difference of 0.060%), and Immigrants from Cuba (92.2%, a difference of 0.060%). Similarly, the demographic groups most similar to Immigrants from Cabo Verde are Mexican American Indian (90.9%, a difference of 0.030%), Hispanic or Latino (90.9%, a difference of 0.050%), Honduran (91.0%, a difference of 0.12%), Dominican (91.1%, a difference of 0.15%), and Immigrants from Nicaragua (91.3%, a difference of 0.45%).
| Demographics | Rating | Rank | 9th Grade |
| Houma | 0.0 /100 | #312 | Tragic 92.3% |
| Vietnamese | 0.0 /100 | #313 | Tragic 92.3% |
| Immigrants | Portugal | 0.0 /100 | #314 | Tragic 92.2% |
| Immigrants | Caribbean | 0.0 /100 | #315 | Tragic 92.2% |
| Cape Verdeans | 0.0 /100 | #316 | Tragic 92.2% |
| Immigrants | Cuba | 0.0 /100 | #317 | Tragic 92.2% |
| Nepalese | 0.0 /100 | #318 | Tragic 92.0% |
| Ecuadorians | 0.0 /100 | #319 | Tragic 91.9% |
| Nicaraguans | 0.0 /100 | #320 | Tragic 91.9% |
| Immigrants | Ecuador | 0.0 /100 | #321 | Tragic 91.8% |
| Belizeans | 0.0 /100 | #322 | Tragic 91.8% |
| Puerto Ricans | 0.0 /100 | #323 | Tragic 91.8% |
| Immigrants | Belize | 0.0 /100 | #324 | Tragic 91.8% |
| Central American Indians | 0.0 /100 | #325 | Tragic 91.5% |
| Immigrants | Armenia | 0.0 /100 | #326 | Tragic 91.4% |
| Immigrants | Nicaragua | 0.0 /100 | #327 | Tragic 91.3% |
| Dominicans | 0.0 /100 | #328 | Tragic 91.1% |
| Hondurans | 0.0 /100 | #329 | Tragic 91.0% |
| Immigrants | Cabo Verde | 0.0 /100 | #330 | Tragic 90.9% |
| Mexican American Indians | 0.0 /100 | #331 | Tragic 90.9% |
| Hispanics or Latinos | 0.0 /100 | #332 | Tragic 90.9% |