Immigrants from Portugal vs German 9th Grade
COMPARE
Immigrants from Portugal
German
9th Grade
9th Grade Comparison
Immigrants from Portugal
Germans
92.2%
9TH GRADE
0.0/ 100
METRIC RATING
314th/ 347
METRIC RANK
96.7%
9TH GRADE
100.0/ 100
METRIC RATING
8th/ 347
METRIC RANK
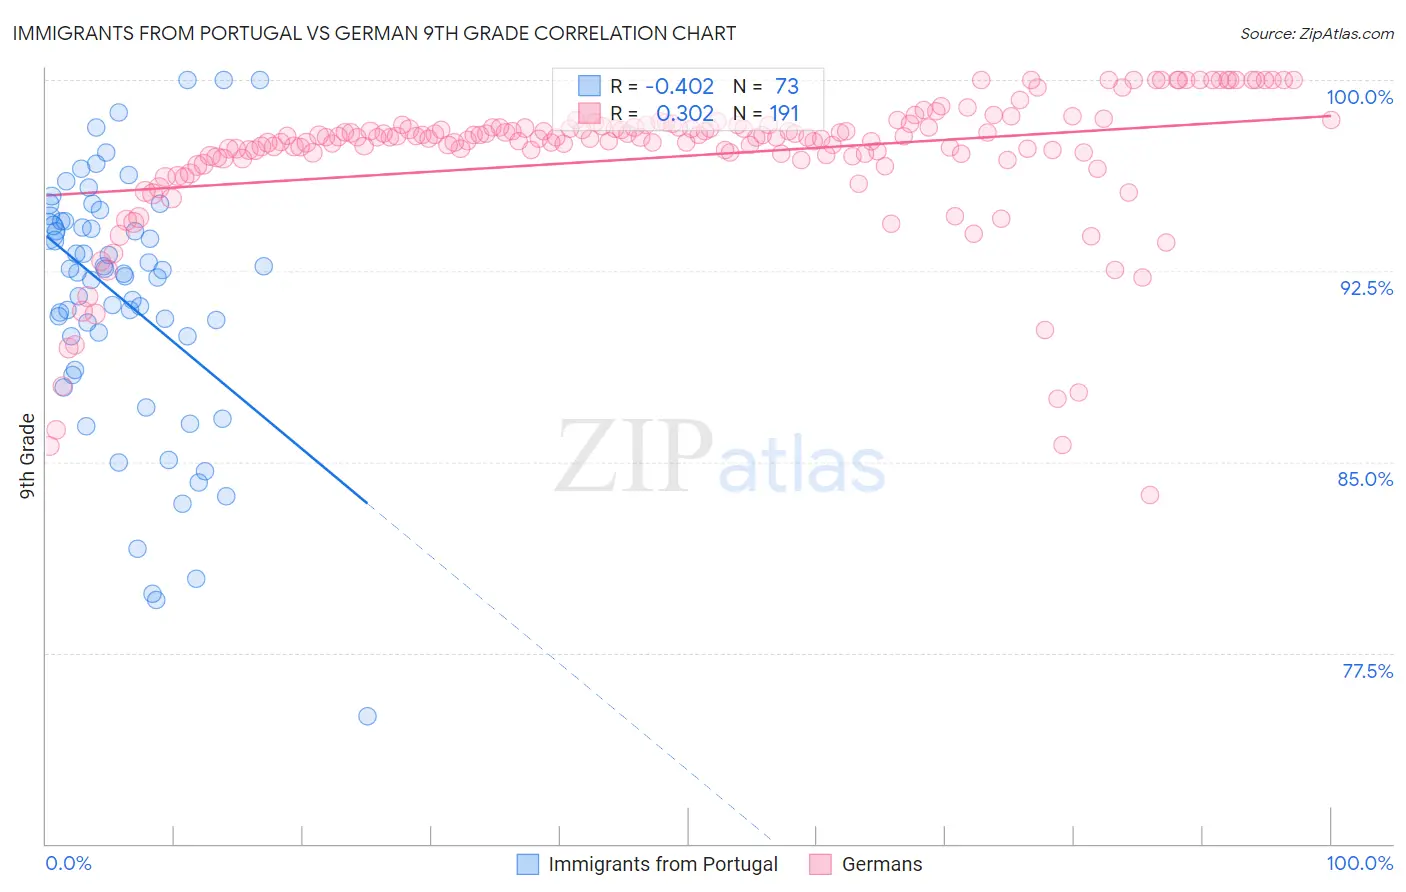
Immigrants from Portugal vs German 9th Grade Correlation Chart
The statistical analysis conducted on geographies consisting of 174,792,107 people shows a moderate negative correlation between the proportion of Immigrants from Portugal and percentage of population with at least 9th grade education in the United States with a correlation coefficient (R) of -0.402 and weighted average of 92.2%. Similarly, the statistical analysis conducted on geographies consisting of 581,302,452 people shows a mild positive correlation between the proportion of Germans and percentage of population with at least 9th grade education in the United States with a correlation coefficient (R) of 0.302 and weighted average of 96.7%, a difference of 4.9%.
9th Grade Correlation Summary
| Measurement | Immigrants from Portugal | German |
| Minimum | 75.0% | 83.7% |
| Maximum | 100.0% | 100.0% |
| Range | 25.0% | 16.3% |
| Mean | 91.3% | 97.0% |
| Median | 92.5% | 97.7% |
| Interquartile 25% (IQ1) | 89.3% | 97.0% |
| Interquartile 75% (IQ3) | 94.5% | 98.1% |
| Interquartile Range (IQR) | 5.2% | 1.2% |
| Standard Deviation (Sample) | 5.1% | 2.9% |
| Standard Deviation (Population) | 5.0% | 2.9% |
Similar Demographics by 9th Grade
Demographics Similar to Immigrants from Portugal by 9th Grade
In terms of 9th grade, the demographic groups most similar to Immigrants from Portugal are Immigrants from Caribbean (92.2%, a difference of 0.010%), Vietnamese (92.3%, a difference of 0.040%), Cape Verdean (92.2%, a difference of 0.050%), Houma (92.3%, a difference of 0.060%), and Immigrants from Cuba (92.2%, a difference of 0.060%).
| Demographics | Rating | Rank | 9th Grade |
| Immigrants | Immigrants | 0.0 /100 | #307 | Tragic 92.5% |
| Immigrants | Guyana | 0.0 /100 | #308 | Tragic 92.5% |
| Immigrants | Bangladesh | 0.0 /100 | #309 | Tragic 92.4% |
| Immigrants | Cambodia | 0.0 /100 | #310 | Tragic 92.4% |
| Immigrants | Fiji | 0.0 /100 | #311 | Tragic 92.3% |
| Houma | 0.0 /100 | #312 | Tragic 92.3% |
| Vietnamese | 0.0 /100 | #313 | Tragic 92.3% |
| Immigrants | Portugal | 0.0 /100 | #314 | Tragic 92.2% |
| Immigrants | Caribbean | 0.0 /100 | #315 | Tragic 92.2% |
| Cape Verdeans | 0.0 /100 | #316 | Tragic 92.2% |
| Immigrants | Cuba | 0.0 /100 | #317 | Tragic 92.2% |
| Nepalese | 0.0 /100 | #318 | Tragic 92.0% |
| Ecuadorians | 0.0 /100 | #319 | Tragic 91.9% |
| Nicaraguans | 0.0 /100 | #320 | Tragic 91.9% |
| Immigrants | Ecuador | 0.0 /100 | #321 | Tragic 91.8% |
Demographics Similar to Germans by 9th Grade
In terms of 9th grade, the demographic groups most similar to Germans are Carpatho Rusyn (96.7%, a difference of 0.010%), Polish (96.7%, a difference of 0.020%), Slovene (96.7%, a difference of 0.030%), Swedish (96.7%, a difference of 0.030%), and Tlingit-Haida (96.6%, a difference of 0.080%).
| Demographics | Rating | Rank | 9th Grade |
| Tsimshian | 100.0 /100 | #1 | Exceptional 97.0% |
| Norwegians | 100.0 /100 | #2 | Exceptional 96.9% |
| Slovaks | 100.0 /100 | #3 | Exceptional 96.9% |
| Slovenes | 100.0 /100 | #4 | Exceptional 96.7% |
| Swedes | 100.0 /100 | #5 | Exceptional 96.7% |
| Poles | 100.0 /100 | #6 | Exceptional 96.7% |
| Carpatho Rusyns | 100.0 /100 | #7 | Exceptional 96.7% |
| Germans | 100.0 /100 | #8 | Exceptional 96.7% |
| Tlingit-Haida | 100.0 /100 | #9 | Exceptional 96.6% |
| Lithuanians | 100.0 /100 | #10 | Exceptional 96.6% |
| Finns | 100.0 /100 | #11 | Exceptional 96.6% |
| English | 100.0 /100 | #12 | Exceptional 96.6% |
| Danes | 100.0 /100 | #13 | Exceptional 96.5% |
| Scottish | 100.0 /100 | #14 | Exceptional 96.5% |
| Irish | 100.0 /100 | #15 | Exceptional 96.5% |