Burmese vs Immigrants from Cabo Verde 9th Grade
COMPARE
Burmese
Immigrants from Cabo Verde
9th Grade
9th Grade Comparison
Burmese
Immigrants from Cabo Verde
95.4%
9TH GRADE
96.0/ 100
METRIC RATING
115th/ 347
METRIC RANK
90.9%
9TH GRADE
0.0/ 100
METRIC RATING
330th/ 347
METRIC RANK
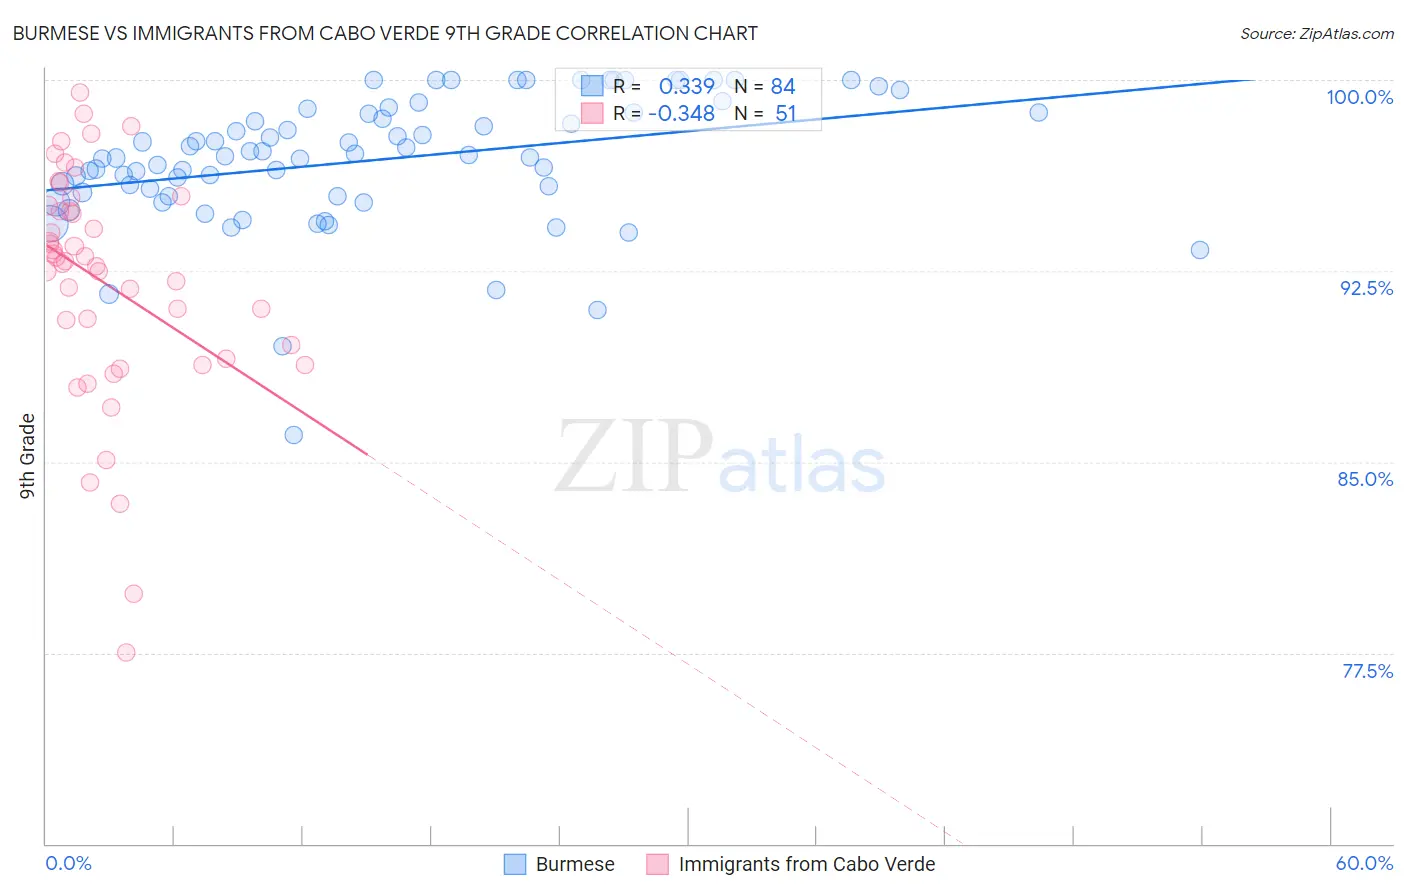
Burmese vs Immigrants from Cabo Verde 9th Grade Correlation Chart
The statistical analysis conducted on geographies consisting of 465,275,888 people shows a mild positive correlation between the proportion of Burmese and percentage of population with at least 9th grade education in the United States with a correlation coefficient (R) of 0.339 and weighted average of 95.4%. Similarly, the statistical analysis conducted on geographies consisting of 38,158,316 people shows a mild negative correlation between the proportion of Immigrants from Cabo Verde and percentage of population with at least 9th grade education in the United States with a correlation coefficient (R) of -0.348 and weighted average of 90.9%, a difference of 5.0%.
9th Grade Correlation Summary
| Measurement | Burmese | Immigrants from Cabo Verde |
| Minimum | 86.1% | 77.5% |
| Maximum | 100.0% | 99.5% |
| Range | 13.9% | 22.0% |
| Mean | 96.9% | 92.1% |
| Median | 97.0% | 92.9% |
| Interquartile 25% (IQ1) | 95.5% | 89.1% |
| Interquartile 75% (IQ3) | 98.7% | 95.1% |
| Interquartile Range (IQR) | 3.2% | 6.0% |
| Standard Deviation (Sample) | 2.6% | 4.6% |
| Standard Deviation (Population) | 2.6% | 4.5% |
Similar Demographics by 9th Grade
Demographics Similar to Burmese by 9th Grade
In terms of 9th grade, the demographic groups most similar to Burmese are German Russian (95.4%, a difference of 0.0%), Cherokee (95.4%, a difference of 0.010%), Immigrants from Croatia (95.4%, a difference of 0.010%), Iroquois (95.4%, a difference of 0.010%), and Immigrants from Europe (95.4%, a difference of 0.010%).
| Demographics | Rating | Rank | 9th Grade |
| Chickasaw | 96.8 /100 | #108 | Exceptional 95.5% |
| Osage | 96.8 /100 | #109 | Exceptional 95.5% |
| Immigrants | Bulgaria | 96.7 /100 | #110 | Exceptional 95.5% |
| Cherokee | 96.3 /100 | #111 | Exceptional 95.4% |
| Immigrants | Croatia | 96.2 /100 | #112 | Exceptional 95.4% |
| Iroquois | 96.2 /100 | #113 | Exceptional 95.4% |
| German Russians | 96.1 /100 | #114 | Exceptional 95.4% |
| Burmese | 96.0 /100 | #115 | Exceptional 95.4% |
| Immigrants | Europe | 95.7 /100 | #116 | Exceptional 95.4% |
| Immigrants | Romania | 95.6 /100 | #117 | Exceptional 95.4% |
| Immigrants | Turkey | 95.6 /100 | #118 | Exceptional 95.4% |
| Soviet Union | 95.6 /100 | #119 | Exceptional 95.4% |
| Cambodians | 95.6 /100 | #120 | Exceptional 95.4% |
| Cree | 95.5 /100 | #121 | Exceptional 95.4% |
| Immigrants | Kuwait | 95.5 /100 | #122 | Exceptional 95.4% |
Demographics Similar to Immigrants from Cabo Verde by 9th Grade
In terms of 9th grade, the demographic groups most similar to Immigrants from Cabo Verde are Mexican American Indian (90.9%, a difference of 0.030%), Hispanic or Latino (90.9%, a difference of 0.050%), Honduran (91.0%, a difference of 0.12%), Immigrants from Yemen (90.8%, a difference of 0.14%), and Dominican (91.1%, a difference of 0.15%).
| Demographics | Rating | Rank | 9th Grade |
| Puerto Ricans | 0.0 /100 | #323 | Tragic 91.8% |
| Immigrants | Belize | 0.0 /100 | #324 | Tragic 91.8% |
| Central American Indians | 0.0 /100 | #325 | Tragic 91.5% |
| Immigrants | Armenia | 0.0 /100 | #326 | Tragic 91.4% |
| Immigrants | Nicaragua | 0.0 /100 | #327 | Tragic 91.3% |
| Dominicans | 0.0 /100 | #328 | Tragic 91.1% |
| Hondurans | 0.0 /100 | #329 | Tragic 91.0% |
| Immigrants | Cabo Verde | 0.0 /100 | #330 | Tragic 90.9% |
| Mexican American Indians | 0.0 /100 | #331 | Tragic 90.9% |
| Hispanics or Latinos | 0.0 /100 | #332 | Tragic 90.9% |
| Immigrants | Yemen | 0.0 /100 | #333 | Tragic 90.8% |
| Immigrants | Azores | 0.0 /100 | #334 | Tragic 90.8% |
| Immigrants | Honduras | 0.0 /100 | #335 | Tragic 90.6% |
| Immigrants | Dominican Republic | 0.0 /100 | #336 | Tragic 90.5% |
| Immigrants | Latin America | 0.0 /100 | #337 | Tragic 90.4% |