Immigrants from Portugal vs New Zealander 9th Grade
COMPARE
Immigrants from Portugal
New Zealander
9th Grade
9th Grade Comparison
Immigrants from Portugal
New Zealanders
92.2%
9TH GRADE
0.0/ 100
METRIC RATING
314th/ 347
METRIC RANK
95.9%
9TH GRADE
99.8/ 100
METRIC RATING
59th/ 347
METRIC RANK
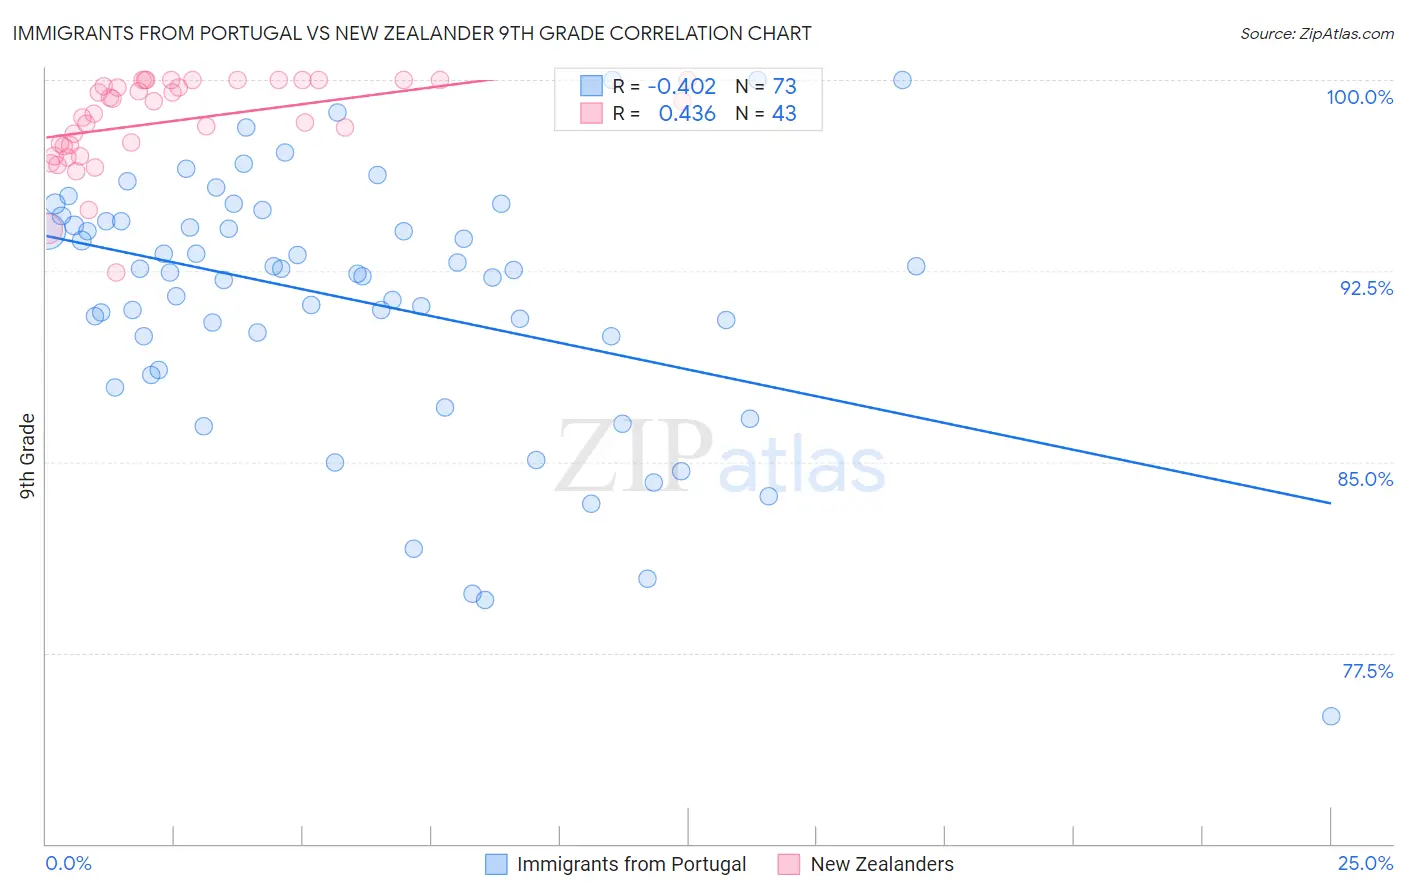
Immigrants from Portugal vs New Zealander 9th Grade Correlation Chart
The statistical analysis conducted on geographies consisting of 174,792,107 people shows a moderate negative correlation between the proportion of Immigrants from Portugal and percentage of population with at least 9th grade education in the United States with a correlation coefficient (R) of -0.402 and weighted average of 92.2%. Similarly, the statistical analysis conducted on geographies consisting of 106,912,053 people shows a moderate positive correlation between the proportion of New Zealanders and percentage of population with at least 9th grade education in the United States with a correlation coefficient (R) of 0.436 and weighted average of 95.9%, a difference of 4.0%.
9th Grade Correlation Summary
| Measurement | Immigrants from Portugal | New Zealander |
| Minimum | 75.0% | 92.5% |
| Maximum | 100.0% | 100.0% |
| Range | 25.0% | 7.5% |
| Mean | 91.3% | 98.4% |
| Median | 92.5% | 99.2% |
| Interquartile 25% (IQ1) | 89.3% | 97.4% |
| Interquartile 75% (IQ3) | 94.5% | 100.0% |
| Interquartile Range (IQR) | 5.2% | 2.6% |
| Standard Deviation (Sample) | 5.1% | 1.8% |
| Standard Deviation (Population) | 5.0% | 1.7% |
Similar Demographics by 9th Grade
Demographics Similar to Immigrants from Portugal by 9th Grade
In terms of 9th grade, the demographic groups most similar to Immigrants from Portugal are Immigrants from Caribbean (92.2%, a difference of 0.010%), Vietnamese (92.3%, a difference of 0.040%), Cape Verdean (92.2%, a difference of 0.050%), Houma (92.3%, a difference of 0.060%), and Immigrants from Cuba (92.2%, a difference of 0.060%).
| Demographics | Rating | Rank | 9th Grade |
| Immigrants | Immigrants | 0.0 /100 | #307 | Tragic 92.5% |
| Immigrants | Guyana | 0.0 /100 | #308 | Tragic 92.5% |
| Immigrants | Bangladesh | 0.0 /100 | #309 | Tragic 92.4% |
| Immigrants | Cambodia | 0.0 /100 | #310 | Tragic 92.4% |
| Immigrants | Fiji | 0.0 /100 | #311 | Tragic 92.3% |
| Houma | 0.0 /100 | #312 | Tragic 92.3% |
| Vietnamese | 0.0 /100 | #313 | Tragic 92.3% |
| Immigrants | Portugal | 0.0 /100 | #314 | Tragic 92.2% |
| Immigrants | Caribbean | 0.0 /100 | #315 | Tragic 92.2% |
| Cape Verdeans | 0.0 /100 | #316 | Tragic 92.2% |
| Immigrants | Cuba | 0.0 /100 | #317 | Tragic 92.2% |
| Nepalese | 0.0 /100 | #318 | Tragic 92.0% |
| Ecuadorians | 0.0 /100 | #319 | Tragic 91.9% |
| Nicaraguans | 0.0 /100 | #320 | Tragic 91.9% |
| Immigrants | Ecuador | 0.0 /100 | #321 | Tragic 91.8% |
Demographics Similar to New Zealanders by 9th Grade
In terms of 9th grade, the demographic groups most similar to New Zealanders are Macedonian (96.0%, a difference of 0.020%), Aleut (96.0%, a difference of 0.020%), Native Hawaiian (95.9%, a difference of 0.020%), Immigrants from Austria (96.0%, a difference of 0.030%), and Immigrants from North America (96.0%, a difference of 0.030%).
| Demographics | Rating | Rank | 9th Grade |
| Serbians | 99.9 /100 | #52 | Exceptional 96.0% |
| Austrians | 99.8 /100 | #53 | Exceptional 96.0% |
| Immigrants | Canada | 99.8 /100 | #54 | Exceptional 96.0% |
| Immigrants | Austria | 99.8 /100 | #55 | Exceptional 96.0% |
| Immigrants | North America | 99.8 /100 | #56 | Exceptional 96.0% |
| Macedonians | 99.8 /100 | #57 | Exceptional 96.0% |
| Aleuts | 99.8 /100 | #58 | Exceptional 96.0% |
| New Zealanders | 99.8 /100 | #59 | Exceptional 95.9% |
| Native Hawaiians | 99.8 /100 | #60 | Exceptional 95.9% |
| Sioux | 99.8 /100 | #61 | Exceptional 95.9% |
| Ukrainians | 99.7 /100 | #62 | Exceptional 95.9% |
| Canadians | 99.7 /100 | #63 | Exceptional 95.9% |
| Zimbabweans | 99.7 /100 | #64 | Exceptional 95.9% |
| Immigrants | England | 99.6 /100 | #65 | Exceptional 95.9% |
| Immigrants | Netherlands | 99.6 /100 | #66 | Exceptional 95.8% |