Immigrants from Poland vs Vietnamese 11th Grade
COMPARE
Immigrants from Poland
Vietnamese
11th Grade
11th Grade Comparison
Immigrants from Poland
Vietnamese
92.8%
11TH GRADE
78.5/ 100
METRIC RATING
149th/ 347
METRIC RANK
89.4%
11TH GRADE
0.0/ 100
METRIC RATING
311th/ 347
METRIC RANK
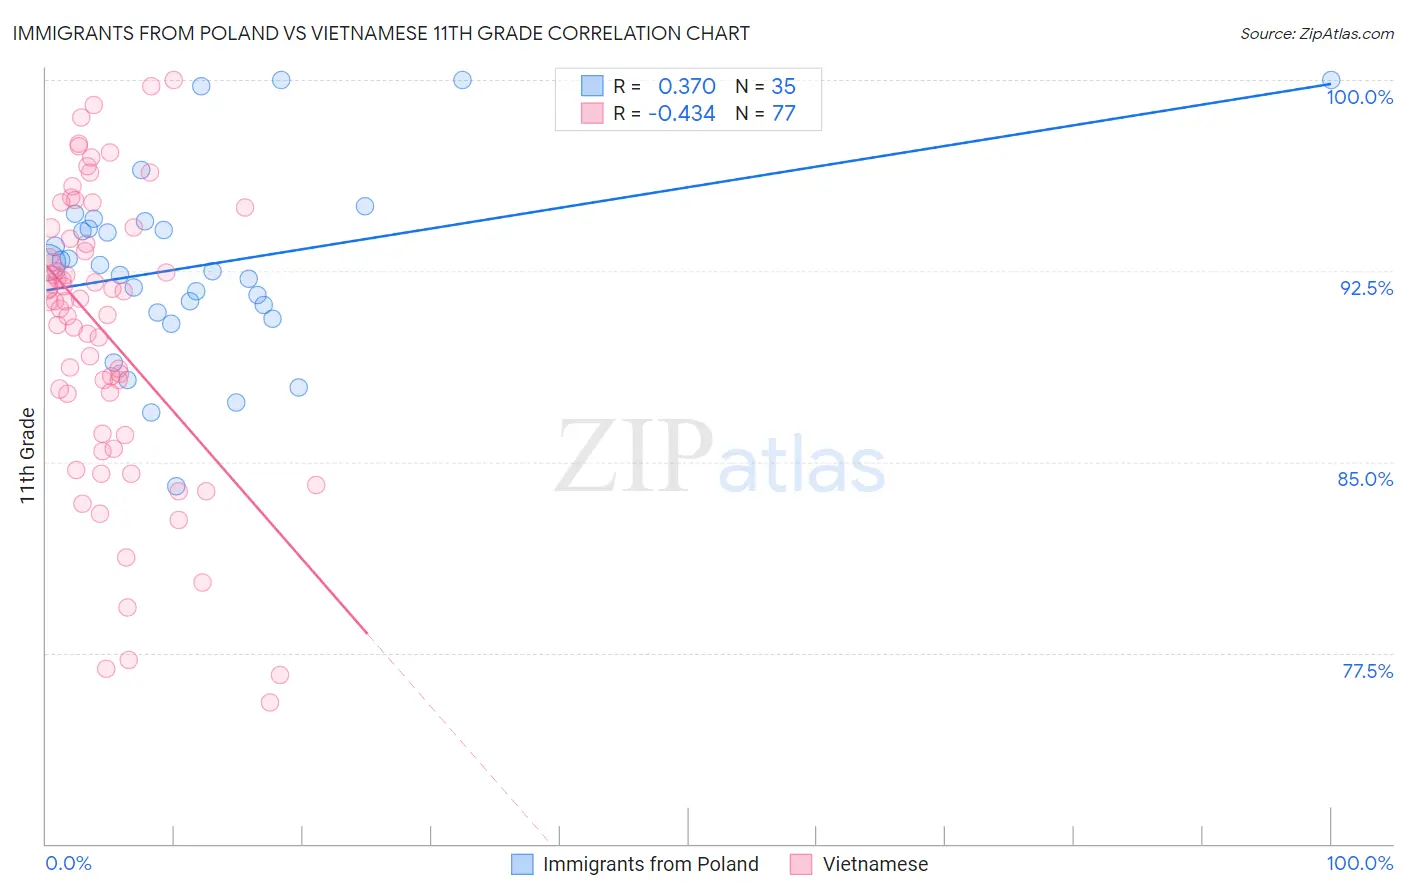
Immigrants from Poland vs Vietnamese 11th Grade Correlation Chart
The statistical analysis conducted on geographies consisting of 304,861,877 people shows a mild positive correlation between the proportion of Immigrants from Poland and percentage of population with at least 11th grade education in the United States with a correlation coefficient (R) of 0.370 and weighted average of 92.8%. Similarly, the statistical analysis conducted on geographies consisting of 170,728,240 people shows a moderate negative correlation between the proportion of Vietnamese and percentage of population with at least 11th grade education in the United States with a correlation coefficient (R) of -0.434 and weighted average of 89.4%, a difference of 3.8%.
11th Grade Correlation Summary
| Measurement | Immigrants from Poland | Vietnamese |
| Minimum | 84.0% | 75.6% |
| Maximum | 100.0% | 100.0% |
| Range | 16.0% | 24.4% |
| Mean | 92.7% | 90.0% |
| Median | 92.8% | 91.3% |
| Interquartile 25% (IQ1) | 90.8% | 86.1% |
| Interquartile 75% (IQ3) | 94.5% | 94.0% |
| Interquartile Range (IQR) | 3.6% | 7.9% |
| Standard Deviation (Sample) | 3.7% | 5.7% |
| Standard Deviation (Population) | 3.6% | 5.7% |
Similar Demographics by 11th Grade
Demographics Similar to Immigrants from Poland by 11th Grade
In terms of 11th grade, the demographic groups most similar to Immigrants from Poland are Immigrants from Kenya (92.8%, a difference of 0.0%), Hmong (92.8%, a difference of 0.0%), Iroquois (92.8%, a difference of 0.010%), Immigrants from Egypt (92.8%, a difference of 0.010%), and Pakistani (92.8%, a difference of 0.020%).
| Demographics | Rating | Rank | 11th Grade |
| Kenyans | 82.0 /100 | #142 | Excellent 92.9% |
| Ugandans | 81.4 /100 | #143 | Excellent 92.9% |
| Assyrians/Chaldeans/Syriacs | 80.5 /100 | #144 | Excellent 92.8% |
| Pakistanis | 79.6 /100 | #145 | Good 92.8% |
| Iroquois | 79.1 /100 | #146 | Good 92.8% |
| Immigrants | Kenya | 78.7 /100 | #147 | Good 92.8% |
| Hmong | 78.6 /100 | #148 | Good 92.8% |
| Immigrants | Poland | 78.5 /100 | #149 | Good 92.8% |
| Immigrants | Egypt | 77.5 /100 | #150 | Good 92.8% |
| Potawatomi | 74.3 /100 | #151 | Good 92.8% |
| Iraqis | 74.2 /100 | #152 | Good 92.8% |
| Brazilians | 73.9 /100 | #153 | Good 92.8% |
| Osage | 73.4 /100 | #154 | Good 92.7% |
| Argentineans | 73.4 /100 | #155 | Good 92.7% |
| Immigrants | Spain | 73.0 /100 | #156 | Good 92.7% |
Demographics Similar to Vietnamese by 11th Grade
In terms of 11th grade, the demographic groups most similar to Vietnamese are Yaqui (89.5%, a difference of 0.060%), Immigrants from Bangladesh (89.5%, a difference of 0.080%), Nepalese (89.5%, a difference of 0.10%), Immigrants from Dominica (89.5%, a difference of 0.12%), and Ecuadorian (89.6%, a difference of 0.17%).
| Demographics | Rating | Rank | 11th Grade |
| Yuman | 0.0 /100 | #304 | Tragic 89.7% |
| Immigrants | Cambodia | 0.0 /100 | #305 | Tragic 89.6% |
| Ecuadorians | 0.0 /100 | #306 | Tragic 89.6% |
| Immigrants | Dominica | 0.0 /100 | #307 | Tragic 89.5% |
| Nepalese | 0.0 /100 | #308 | Tragic 89.5% |
| Immigrants | Bangladesh | 0.0 /100 | #309 | Tragic 89.5% |
| Yaqui | 0.0 /100 | #310 | Tragic 89.5% |
| Vietnamese | 0.0 /100 | #311 | Tragic 89.4% |
| Immigrants | Portugal | 0.0 /100 | #312 | Tragic 89.3% |
| Immigrants | Caribbean | 0.0 /100 | #313 | Tragic 89.1% |
| Cape Verdeans | 0.0 /100 | #314 | Tragic 89.1% |
| Immigrants | Ecuador | 0.0 /100 | #315 | Tragic 89.1% |
| Immigrants | Cuba | 0.0 /100 | #316 | Tragic 88.9% |
| Lumbee | 0.0 /100 | #317 | Tragic 88.9% |
| Nicaraguans | 0.0 /100 | #318 | Tragic 88.9% |