British vs Vietnamese 11th Grade
COMPARE
British
Vietnamese
11th Grade
11th Grade Comparison
British
Vietnamese
94.2%
11TH GRADE
99.9/ 100
METRIC RATING
33rd/ 347
METRIC RANK
89.4%
11TH GRADE
0.0/ 100
METRIC RATING
311th/ 347
METRIC RANK
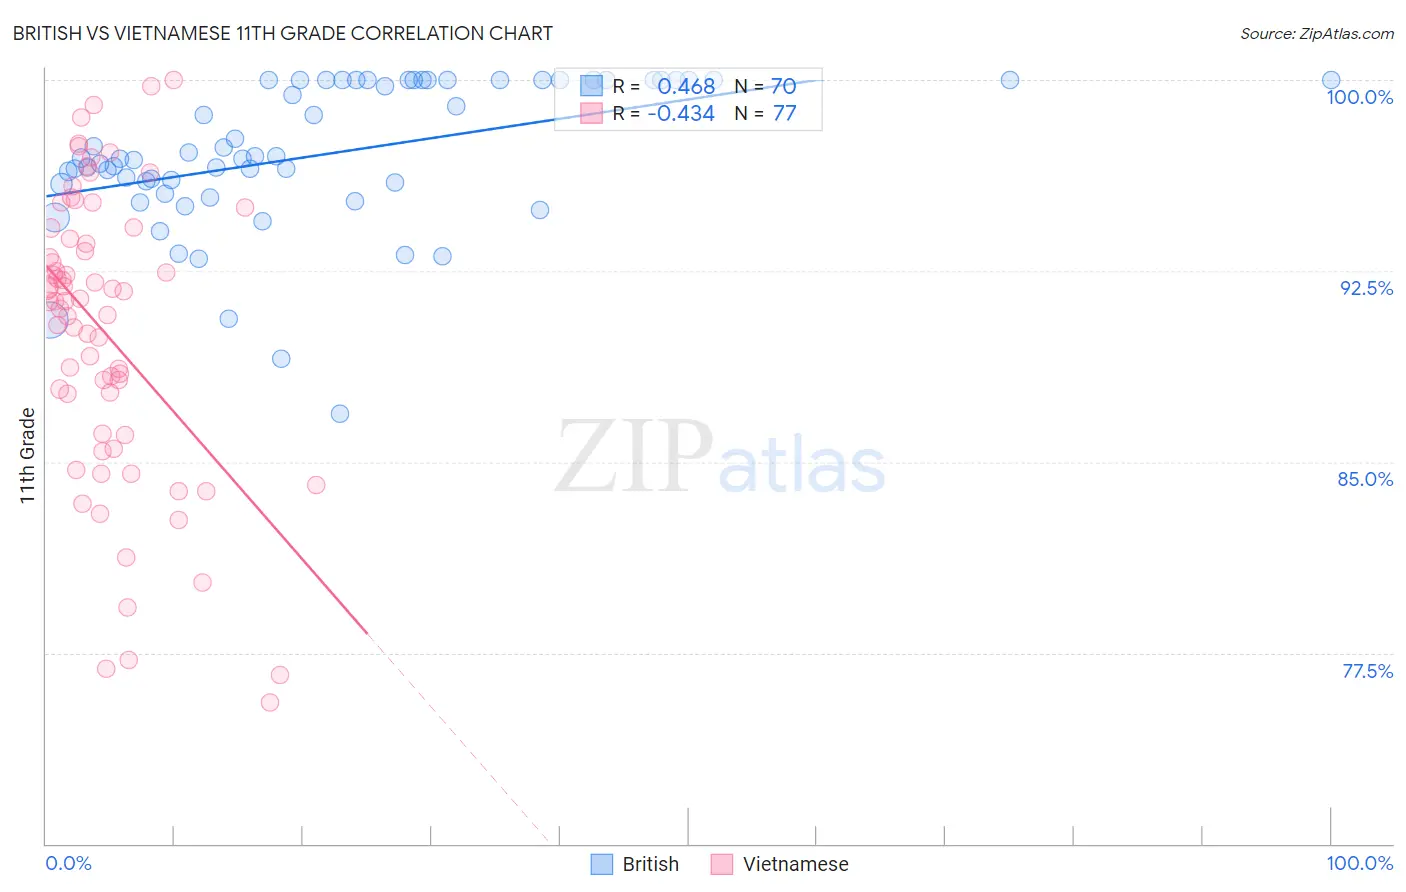
British vs Vietnamese 11th Grade Correlation Chart
The statistical analysis conducted on geographies consisting of 531,463,483 people shows a moderate positive correlation between the proportion of British and percentage of population with at least 11th grade education in the United States with a correlation coefficient (R) of 0.468 and weighted average of 94.2%. Similarly, the statistical analysis conducted on geographies consisting of 170,728,240 people shows a moderate negative correlation between the proportion of Vietnamese and percentage of population with at least 11th grade education in the United States with a correlation coefficient (R) of -0.434 and weighted average of 89.4%, a difference of 5.3%.
11th Grade Correlation Summary
| Measurement | British | Vietnamese |
| Minimum | 86.9% | 75.6% |
| Maximum | 100.0% | 100.0% |
| Range | 13.1% | 24.4% |
| Mean | 97.1% | 90.0% |
| Median | 96.9% | 91.3% |
| Interquartile 25% (IQ1) | 95.9% | 86.1% |
| Interquartile 75% (IQ3) | 100.0% | 94.0% |
| Interquartile Range (IQR) | 4.1% | 7.9% |
| Standard Deviation (Sample) | 2.9% | 5.7% |
| Standard Deviation (Population) | 2.9% | 5.7% |
Similar Demographics by 11th Grade
Demographics Similar to British by 11th Grade
In terms of 11th grade, the demographic groups most similar to British are Immigrants from Scotland (94.2%, a difference of 0.0%), Immigrants from Singapore (94.2%, a difference of 0.010%), Immigrants from Northern Europe (94.2%, a difference of 0.010%), Northern European (94.2%, a difference of 0.020%), and Hungarian (94.2%, a difference of 0.020%).
| Demographics | Rating | Rank | 11th Grade |
| Scottish | 100.0 /100 | #26 | Exceptional 94.4% |
| Europeans | 100.0 /100 | #27 | Exceptional 94.4% |
| Estonians | 100.0 /100 | #28 | Exceptional 94.4% |
| Dutch | 100.0 /100 | #29 | Exceptional 94.3% |
| Russians | 100.0 /100 | #30 | Exceptional 94.3% |
| Welsh | 99.9 /100 | #31 | Exceptional 94.2% |
| Belgians | 99.9 /100 | #32 | Exceptional 94.2% |
| British | 99.9 /100 | #33 | Exceptional 94.2% |
| Immigrants | Scotland | 99.9 /100 | #34 | Exceptional 94.2% |
| Immigrants | Singapore | 99.9 /100 | #35 | Exceptional 94.2% |
| Immigrants | Northern Europe | 99.9 /100 | #36 | Exceptional 94.2% |
| Northern Europeans | 99.9 /100 | #37 | Exceptional 94.2% |
| Hungarians | 99.9 /100 | #38 | Exceptional 94.2% |
| Immigrants | Lithuania | 99.9 /100 | #39 | Exceptional 94.1% |
| Thais | 99.9 /100 | #40 | Exceptional 94.1% |
Demographics Similar to Vietnamese by 11th Grade
In terms of 11th grade, the demographic groups most similar to Vietnamese are Yaqui (89.5%, a difference of 0.060%), Immigrants from Bangladesh (89.5%, a difference of 0.080%), Nepalese (89.5%, a difference of 0.10%), Immigrants from Dominica (89.5%, a difference of 0.12%), and Ecuadorian (89.6%, a difference of 0.17%).
| Demographics | Rating | Rank | 11th Grade |
| Yuman | 0.0 /100 | #304 | Tragic 89.7% |
| Immigrants | Cambodia | 0.0 /100 | #305 | Tragic 89.6% |
| Ecuadorians | 0.0 /100 | #306 | Tragic 89.6% |
| Immigrants | Dominica | 0.0 /100 | #307 | Tragic 89.5% |
| Nepalese | 0.0 /100 | #308 | Tragic 89.5% |
| Immigrants | Bangladesh | 0.0 /100 | #309 | Tragic 89.5% |
| Yaqui | 0.0 /100 | #310 | Tragic 89.5% |
| Vietnamese | 0.0 /100 | #311 | Tragic 89.4% |
| Immigrants | Portugal | 0.0 /100 | #312 | Tragic 89.3% |
| Immigrants | Caribbean | 0.0 /100 | #313 | Tragic 89.1% |
| Cape Verdeans | 0.0 /100 | #314 | Tragic 89.1% |
| Immigrants | Ecuador | 0.0 /100 | #315 | Tragic 89.1% |
| Immigrants | Cuba | 0.0 /100 | #316 | Tragic 88.9% |
| Lumbee | 0.0 /100 | #317 | Tragic 88.9% |
| Nicaraguans | 0.0 /100 | #318 | Tragic 88.9% |