Immigrants from Poland vs Australian Unemployment Among Ages 25 to 29 years
COMPARE
Immigrants from Poland
Australian
Unemployment Among Ages 25 to 29 years
Unemployment Among Ages 25 to 29 years Comparison
Immigrants from Poland
Australians
6.3%
UNEMPLOYMENT AMONG AGES 25 TO 29 YEARS
95.7/ 100
METRIC RATING
82nd/ 347
METRIC RANK
6.4%
UNEMPLOYMENT AMONG AGES 25 TO 29 YEARS
93.6/ 100
METRIC RATING
93rd/ 347
METRIC RANK
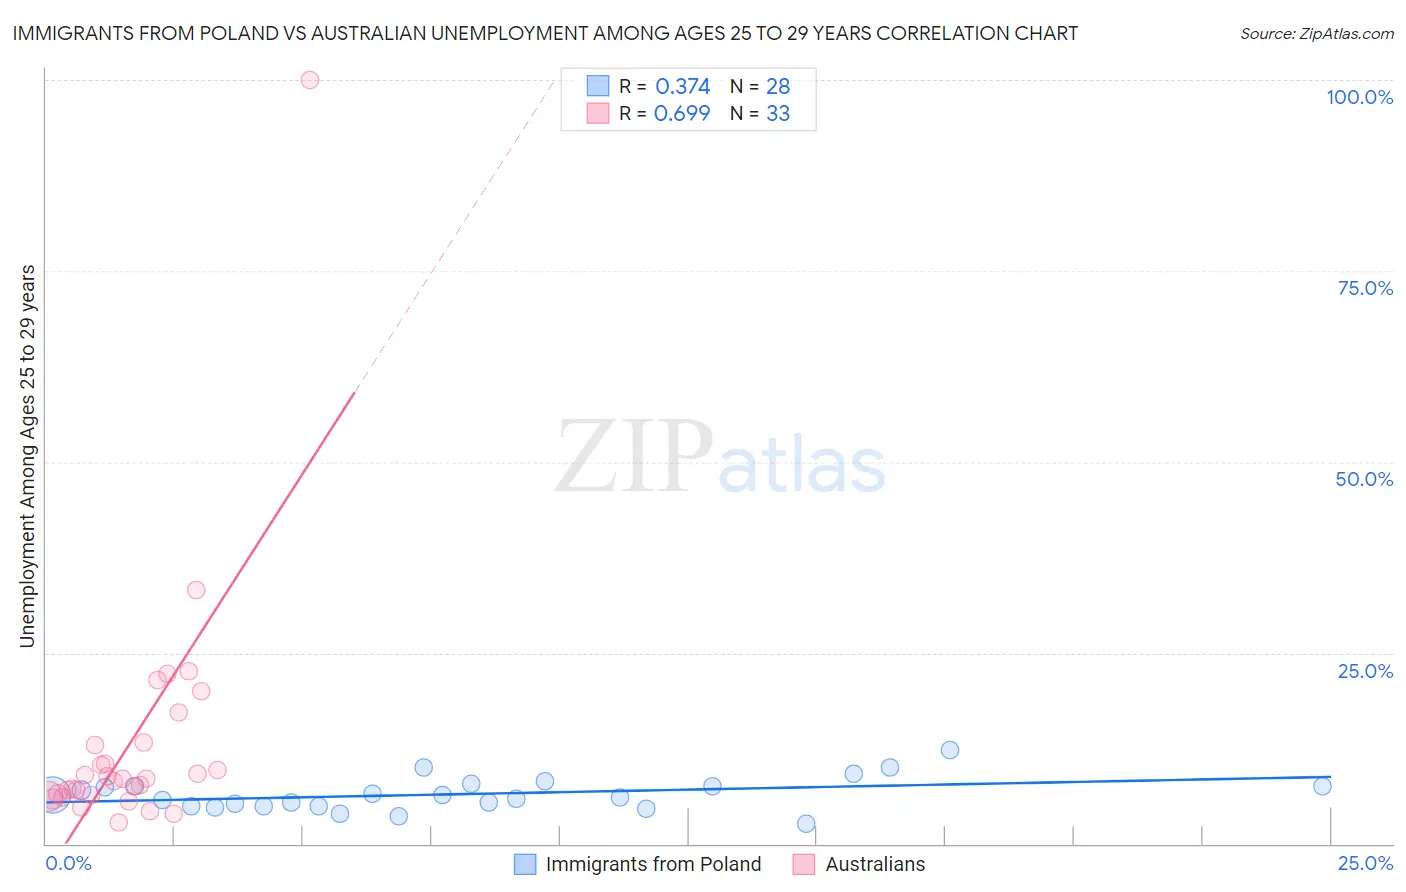
Immigrants from Poland vs Australian Unemployment Among Ages 25 to 29 years Correlation Chart
The statistical analysis conducted on geographies consisting of 291,999,632 people shows a mild positive correlation between the proportion of Immigrants from Poland and unemployment rate among population between the ages 25 and 29 in the United States with a correlation coefficient (R) of 0.374 and weighted average of 6.3%. Similarly, the statistical analysis conducted on geographies consisting of 216,520,214 people shows a significant positive correlation between the proportion of Australians and unemployment rate among population between the ages 25 and 29 in the United States with a correlation coefficient (R) of 0.699 and weighted average of 6.4%, a difference of 0.65%.
Unemployment Among Ages 25 to 29 years Correlation Summary
| Measurement | Immigrants from Poland | Australian |
| Minimum | 2.7% | 2.8% |
| Maximum | 12.2% | 100.0% |
| Range | 9.5% | 97.2% |
| Mean | 6.5% | 13.2% |
| Median | 6.2% | 8.4% |
| Interquartile 25% (IQ1) | 4.9% | 6.3% |
| Interquartile 75% (IQ3) | 7.5% | 13.1% |
| Interquartile Range (IQR) | 2.6% | 6.8% |
| Standard Deviation (Sample) | 2.1% | 17.0% |
| Standard Deviation (Population) | 2.1% | 16.7% |
Demographics Similar to Immigrants from Poland and Australians by Unemployment Among Ages 25 to 29 years
In terms of unemployment among ages 25 to 29 years, the demographic groups most similar to Immigrants from Poland are Iranian (6.3%, a difference of 0.040%), Immigrants from Romania (6.3%, a difference of 0.080%), Slovene (6.3%, a difference of 0.13%), Immigrants from Switzerland (6.3%, a difference of 0.14%), and Immigrants from Spain (6.3%, a difference of 0.17%). Similarly, the demographic groups most similar to Australians are Immigrants from North Macedonia (6.4%, a difference of 0.0%), Zimbabwean (6.4%, a difference of 0.050%), Egyptian (6.4%, a difference of 0.060%), Lebanese (6.4%, a difference of 0.070%), and Immigrants from Oceania (6.4%, a difference of 0.14%).
| Demographics | Rating | Rank | Unemployment Among Ages 25 to 29 years |
| Icelanders | 96.6 /100 | #77 | Exceptional 6.3% |
| Asians | 96.4 /100 | #78 | Exceptional 6.3% |
| Immigrants | Switzerland | 96.0 /100 | #79 | Exceptional 6.3% |
| Immigrants | Romania | 95.9 /100 | #80 | Exceptional 6.3% |
| Iranians | 95.8 /100 | #81 | Exceptional 6.3% |
| Immigrants | Poland | 95.7 /100 | #82 | Exceptional 6.3% |
| Slovenes | 95.3 /100 | #83 | Exceptional 6.3% |
| Immigrants | Spain | 95.2 /100 | #84 | Exceptional 6.3% |
| Immigrants | Sweden | 95.1 /100 | #85 | Exceptional 6.3% |
| Immigrants | Asia | 94.9 /100 | #86 | Exceptional 6.3% |
| Marshallese | 94.7 /100 | #87 | Exceptional 6.4% |
| Immigrants | Indonesia | 94.5 /100 | #88 | Exceptional 6.4% |
| Immigrants | Oceania | 94.1 /100 | #89 | Exceptional 6.4% |
| Lebanese | 93.9 /100 | #90 | Exceptional 6.4% |
| Egyptians | 93.9 /100 | #91 | Exceptional 6.4% |
| Immigrants | North Macedonia | 93.6 /100 | #92 | Exceptional 6.4% |
| Australians | 93.6 /100 | #93 | Exceptional 6.4% |
| Zimbabweans | 93.5 /100 | #94 | Exceptional 6.4% |
| Afghans | 92.5 /100 | #95 | Exceptional 6.4% |
| Immigrants | Brazil | 92.1 /100 | #96 | Exceptional 6.4% |
| Immigrants | Eastern Europe | 91.9 /100 | #97 | Exceptional 6.4% |