Immigrants from Philippines vs Zimbabwean High School Diploma
COMPARE
Immigrants from Philippines
Zimbabwean
High School Diploma
High School Diploma Comparison
Immigrants from Philippines
Zimbabweans
87.8%
HIGH SCHOOL DIPLOMA
1.9/ 100
METRIC RATING
243rd/ 347
METRIC RANK
91.1%
HIGH SCHOOL DIPLOMA
99.7/ 100
METRIC RATING
57th/ 347
METRIC RANK
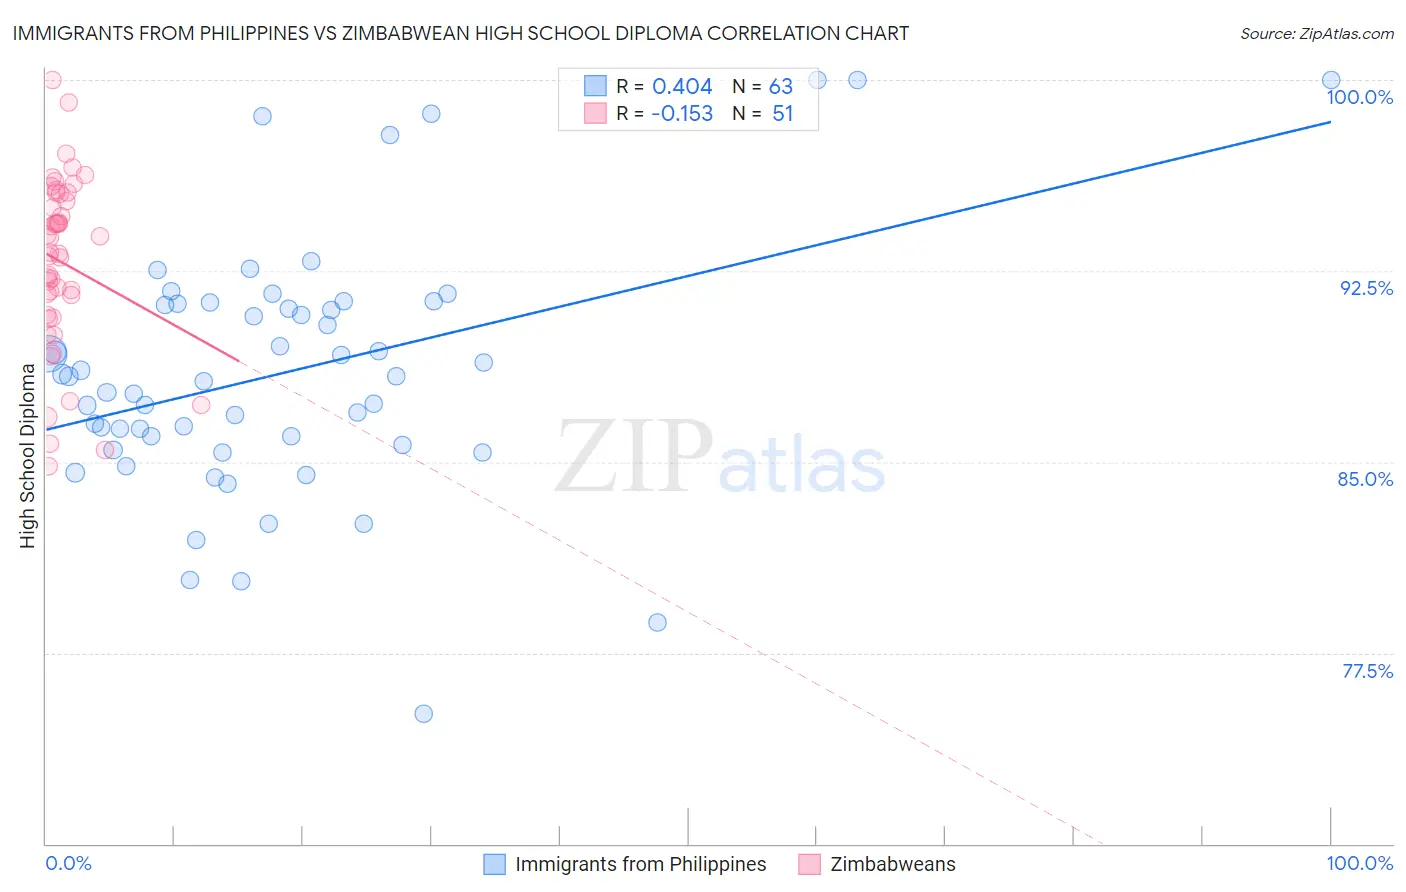
Immigrants from Philippines vs Zimbabwean High School Diploma Correlation Chart
The statistical analysis conducted on geographies consisting of 471,300,535 people shows a moderate positive correlation between the proportion of Immigrants from Philippines and percentage of population with at least high school diploma education in the United States with a correlation coefficient (R) of 0.404 and weighted average of 87.8%. Similarly, the statistical analysis conducted on geographies consisting of 69,203,423 people shows a poor negative correlation between the proportion of Zimbabweans and percentage of population with at least high school diploma education in the United States with a correlation coefficient (R) of -0.153 and weighted average of 91.1%, a difference of 3.7%.
High School Diploma Correlation Summary
| Measurement | Immigrants from Philippines | Zimbabwean |
| Minimum | 75.1% | 84.8% |
| Maximum | 100.0% | 100.0% |
| Range | 24.9% | 15.2% |
| Mean | 88.5% | 92.9% |
| Median | 88.3% | 93.2% |
| Interquartile 25% (IQ1) | 85.7% | 90.8% |
| Interquartile 75% (IQ3) | 91.2% | 95.5% |
| Interquartile Range (IQR) | 5.6% | 4.8% |
| Standard Deviation (Sample) | 5.0% | 3.4% |
| Standard Deviation (Population) | 4.9% | 3.3% |
Similar Demographics by High School Diploma
Demographics Similar to Immigrants from Philippines by High School Diploma
In terms of high school diploma, the demographic groups most similar to Immigrants from Philippines are Choctaw (87.8%, a difference of 0.0%), Peruvian (87.8%, a difference of 0.010%), Immigrants from Uzbekistan (87.8%, a difference of 0.020%), Cheyenne (87.8%, a difference of 0.020%), and Comanche (87.9%, a difference of 0.050%).
| Demographics | Rating | Rank | High School Diploma |
| Sub-Saharan Africans | 2.8 /100 | #236 | Tragic 87.9% |
| Taiwanese | 2.8 /100 | #237 | Tragic 87.9% |
| Sioux | 2.7 /100 | #238 | Tragic 87.9% |
| South Americans | 2.7 /100 | #239 | Tragic 87.9% |
| Comanche | 2.2 /100 | #240 | Tragic 87.9% |
| Immigrants | Uzbekistan | 2.1 /100 | #241 | Tragic 87.8% |
| Cheyenne | 2.1 /100 | #242 | Tragic 87.8% |
| Immigrants | Philippines | 1.9 /100 | #243 | Tragic 87.8% |
| Choctaw | 1.9 /100 | #244 | Tragic 87.8% |
| Peruvians | 1.9 /100 | #245 | Tragic 87.8% |
| Immigrants | Eritrea | 1.7 /100 | #246 | Tragic 87.8% |
| Immigrants | Costa Rica | 1.7 /100 | #247 | Tragic 87.8% |
| Spanish Americans | 1.5 /100 | #248 | Tragic 87.7% |
| Senegalese | 1.5 /100 | #249 | Tragic 87.7% |
| Immigrants | Nigeria | 1.5 /100 | #250 | Tragic 87.7% |
Demographics Similar to Zimbabweans by High School Diploma
In terms of high school diploma, the demographic groups most similar to Zimbabweans are Slavic (91.0%, a difference of 0.010%), Immigrants from North America (91.0%, a difference of 0.010%), Immigrants from Canada (91.1%, a difference of 0.020%), Immigrants from Japan (91.0%, a difference of 0.040%), and Serbian (91.1%, a difference of 0.050%).
| Demographics | Rating | Rank | High School Diploma |
| Welsh | 99.8 /100 | #50 | Exceptional 91.2% |
| New Zealanders | 99.7 /100 | #51 | Exceptional 91.1% |
| Immigrants | Sweden | 99.7 /100 | #52 | Exceptional 91.1% |
| Immigrants | Belgium | 99.7 /100 | #53 | Exceptional 91.1% |
| Macedonians | 99.7 /100 | #54 | Exceptional 91.1% |
| Serbians | 99.7 /100 | #55 | Exceptional 91.1% |
| Immigrants | Canada | 99.7 /100 | #56 | Exceptional 91.1% |
| Zimbabweans | 99.7 /100 | #57 | Exceptional 91.1% |
| Slavs | 99.7 /100 | #58 | Exceptional 91.0% |
| Immigrants | North America | 99.7 /100 | #59 | Exceptional 91.0% |
| Immigrants | Japan | 99.6 /100 | #60 | Exceptional 91.0% |
| Immigrants | Taiwan | 99.6 /100 | #61 | Exceptional 91.0% |
| Austrians | 99.6 /100 | #62 | Exceptional 91.0% |
| Immigrants | Netherlands | 99.6 /100 | #63 | Exceptional 91.0% |
| Ukrainians | 99.6 /100 | #64 | Exceptional 91.0% |