Immigrants from Philippines vs Marshallese Kindergarten
COMPARE
Immigrants from Philippines
Marshallese
Kindergarten
Kindergarten Comparison
Immigrants from Philippines
Marshallese
97.4%
KINDERGARTEN
0.1/ 100
METRIC RATING
276th/ 347
METRIC RANK
98.1%
KINDERGARTEN
83.0/ 100
METRIC RATING
141st/ 347
METRIC RANK
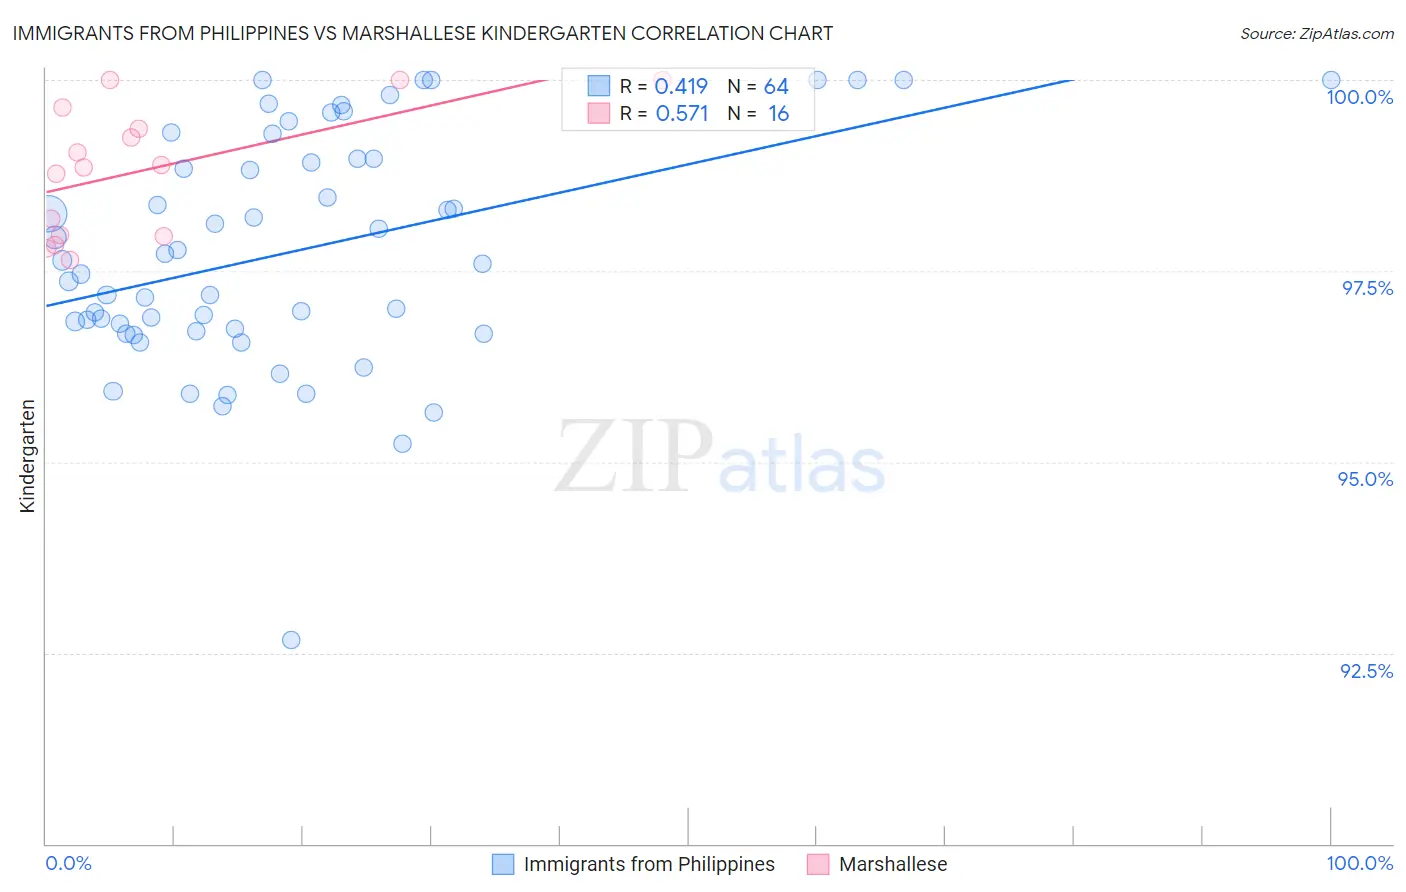
Immigrants from Philippines vs Marshallese Kindergarten Correlation Chart
The statistical analysis conducted on geographies consisting of 471,303,140 people shows a moderate positive correlation between the proportion of Immigrants from Philippines and percentage of population with at least kindergarten education in the United States with a correlation coefficient (R) of 0.419 and weighted average of 97.4%. Similarly, the statistical analysis conducted on geographies consisting of 14,761,315 people shows a substantial positive correlation between the proportion of Marshallese and percentage of population with at least kindergarten education in the United States with a correlation coefficient (R) of 0.571 and weighted average of 98.1%, a difference of 0.66%.
Kindergarten Correlation Summary
| Measurement | Immigrants from Philippines | Marshallese |
| Minimum | 92.7% | 97.6% |
| Maximum | 100.0% | 100.0% |
| Range | 7.3% | 2.4% |
| Mean | 97.8% | 98.8% |
| Median | 97.6% | 98.9% |
| Interquartile 25% (IQ1) | 96.7% | 98.0% |
| Interquartile 75% (IQ3) | 99.0% | 99.5% |
| Interquartile Range (IQR) | 2.2% | 1.5% |
| Standard Deviation (Sample) | 1.5% | 0.84% |
| Standard Deviation (Population) | 1.5% | 0.82% |
Similar Demographics by Kindergarten
Demographics Similar to Immigrants from Philippines by Kindergarten
In terms of kindergarten, the demographic groups most similar to Immigrants from Philippines are Immigrants from Western Africa (97.4%, a difference of 0.010%), Immigrants from China (97.4%, a difference of 0.020%), Immigrants from Cameroon (97.4%, a difference of 0.020%), Ghanaian (97.4%, a difference of 0.020%), and Immigrants from Uzbekistan (97.4%, a difference of 0.030%).
| Demographics | Rating | Rank | Kindergarten |
| West Indians | 0.3 /100 | #269 | Tragic 97.5% |
| Immigrants | Jamaica | 0.2 /100 | #270 | Tragic 97.5% |
| Immigrants | Peru | 0.2 /100 | #271 | Tragic 97.5% |
| Immigrants | Bolivia | 0.2 /100 | #272 | Tragic 97.5% |
| Immigrants | China | 0.1 /100 | #273 | Tragic 97.4% |
| Immigrants | Cameroon | 0.1 /100 | #274 | Tragic 97.4% |
| Ghanaians | 0.1 /100 | #275 | Tragic 97.4% |
| Immigrants | Philippines | 0.1 /100 | #276 | Tragic 97.4% |
| Immigrants | Western Africa | 0.1 /100 | #277 | Tragic 97.4% |
| Immigrants | Uzbekistan | 0.1 /100 | #278 | Tragic 97.4% |
| Immigrants | Ghana | 0.1 /100 | #279 | Tragic 97.4% |
| Barbadians | 0.1 /100 | #280 | Tragic 97.4% |
| Trinidadians and Tobagonians | 0.1 /100 | #281 | Tragic 97.4% |
| Afghans | 0.0 /100 | #282 | Tragic 97.4% |
| Immigrants | West Indies | 0.0 /100 | #283 | Tragic 97.3% |
Demographics Similar to Marshallese by Kindergarten
In terms of kindergarten, the demographic groups most similar to Marshallese are Palestinian (98.1%, a difference of 0.0%), Immigrants from Turkey (98.1%, a difference of 0.0%), Burmese (98.1%, a difference of 0.010%), Alsatian (98.1%, a difference of 0.010%), and Hmong (98.1%, a difference of 0.020%).
| Demographics | Rating | Rank | Kindergarten |
| Immigrants | Bulgaria | 89.4 /100 | #134 | Excellent 98.1% |
| Immigrants | Kuwait | 89.2 /100 | #135 | Excellent 98.1% |
| Immigrants | Hungary | 89.1 /100 | #136 | Excellent 98.1% |
| Blackfeet | 87.8 /100 | #137 | Excellent 98.1% |
| Immigrants | Romania | 87.7 /100 | #138 | Excellent 98.1% |
| Israelis | 87.7 /100 | #139 | Excellent 98.1% |
| Palestinians | 83.6 /100 | #140 | Excellent 98.1% |
| Marshallese | 83.0 /100 | #141 | Excellent 98.1% |
| Immigrants | Turkey | 82.8 /100 | #142 | Excellent 98.1% |
| Burmese | 81.5 /100 | #143 | Excellent 98.1% |
| Alsatians | 80.4 /100 | #144 | Excellent 98.1% |
| Hmong | 78.8 /100 | #145 | Good 98.1% |
| Filipinos | 78.3 /100 | #146 | Good 98.0% |
| Immigrants | Israel | 77.6 /100 | #147 | Good 98.0% |
| Apache | 75.0 /100 | #148 | Good 98.0% |