Immigrants from Philippines vs Icelander Kindergarten
COMPARE
Immigrants from Philippines
Icelander
Kindergarten
Kindergarten Comparison
Immigrants from Philippines
Icelanders
97.4%
KINDERGARTEN
0.1/ 100
METRIC RATING
276th/ 347
METRIC RANK
98.3%
KINDERGARTEN
99.2/ 100
METRIC RATING
81st/ 347
METRIC RANK
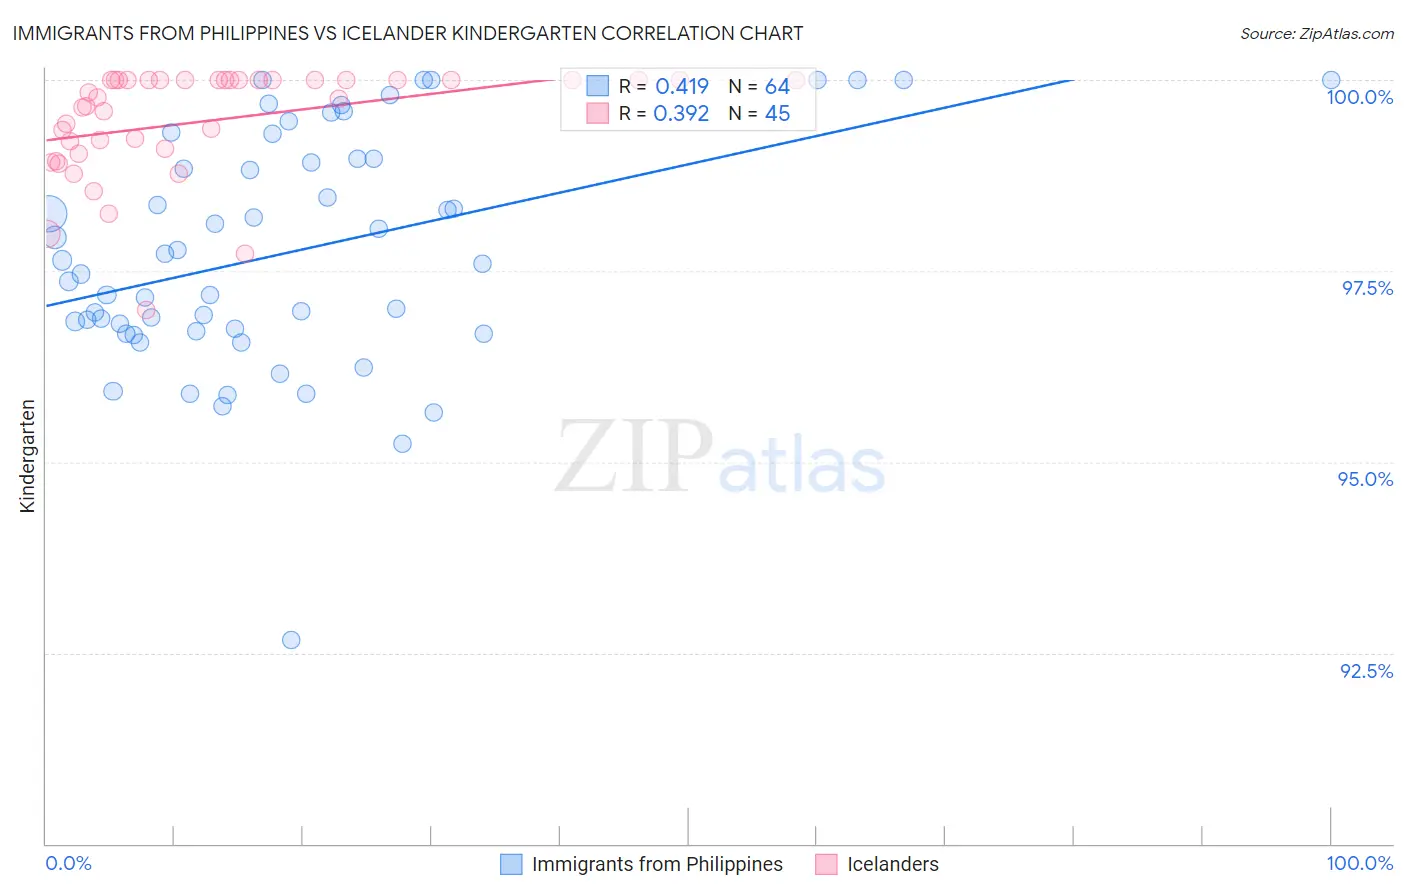
Immigrants from Philippines vs Icelander Kindergarten Correlation Chart
The statistical analysis conducted on geographies consisting of 471,303,140 people shows a moderate positive correlation between the proportion of Immigrants from Philippines and percentage of population with at least kindergarten education in the United States with a correlation coefficient (R) of 0.419 and weighted average of 97.4%. Similarly, the statistical analysis conducted on geographies consisting of 159,668,748 people shows a mild positive correlation between the proportion of Icelanders and percentage of population with at least kindergarten education in the United States with a correlation coefficient (R) of 0.392 and weighted average of 98.3%, a difference of 0.91%.
Kindergarten Correlation Summary
| Measurement | Immigrants from Philippines | Icelander |
| Minimum | 92.7% | 97.0% |
| Maximum | 100.0% | 100.0% |
| Range | 7.3% | 3.0% |
| Mean | 97.8% | 99.5% |
| Median | 97.6% | 99.8% |
| Interquartile 25% (IQ1) | 96.7% | 99.1% |
| Interquartile 75% (IQ3) | 99.0% | 100.0% |
| Interquartile Range (IQR) | 2.2% | 0.93% |
| Standard Deviation (Sample) | 1.5% | 0.71% |
| Standard Deviation (Population) | 1.5% | 0.71% |
Similar Demographics by Kindergarten
Demographics Similar to Immigrants from Philippines by Kindergarten
In terms of kindergarten, the demographic groups most similar to Immigrants from Philippines are Immigrants from Western Africa (97.4%, a difference of 0.010%), Immigrants from China (97.4%, a difference of 0.020%), Immigrants from Cameroon (97.4%, a difference of 0.020%), Ghanaian (97.4%, a difference of 0.020%), and Immigrants from Uzbekistan (97.4%, a difference of 0.030%).
| Demographics | Rating | Rank | Kindergarten |
| West Indians | 0.3 /100 | #269 | Tragic 97.5% |
| Immigrants | Jamaica | 0.2 /100 | #270 | Tragic 97.5% |
| Immigrants | Peru | 0.2 /100 | #271 | Tragic 97.5% |
| Immigrants | Bolivia | 0.2 /100 | #272 | Tragic 97.5% |
| Immigrants | China | 0.1 /100 | #273 | Tragic 97.4% |
| Immigrants | Cameroon | 0.1 /100 | #274 | Tragic 97.4% |
| Ghanaians | 0.1 /100 | #275 | Tragic 97.4% |
| Immigrants | Philippines | 0.1 /100 | #276 | Tragic 97.4% |
| Immigrants | Western Africa | 0.1 /100 | #277 | Tragic 97.4% |
| Immigrants | Uzbekistan | 0.1 /100 | #278 | Tragic 97.4% |
| Immigrants | Ghana | 0.1 /100 | #279 | Tragic 97.4% |
| Barbadians | 0.1 /100 | #280 | Tragic 97.4% |
| Trinidadians and Tobagonians | 0.1 /100 | #281 | Tragic 97.4% |
| Afghans | 0.0 /100 | #282 | Tragic 97.4% |
| Immigrants | West Indies | 0.0 /100 | #283 | Tragic 97.3% |
Demographics Similar to Icelanders by Kindergarten
In terms of kindergarten, the demographic groups most similar to Icelanders are Shoshone (98.3%, a difference of 0.0%), Immigrants from Belgium (98.3%, a difference of 0.0%), Immigrants from Lithuania (98.3%, a difference of 0.0%), Potawatomi (98.3%, a difference of 0.0%), and Osage (98.3%, a difference of 0.0%).
| Demographics | Rating | Rank | Kindergarten |
| Immigrants | Netherlands | 99.3 /100 | #74 | Exceptional 98.3% |
| Cherokee | 99.3 /100 | #75 | Exceptional 98.3% |
| Immigrants | England | 99.3 /100 | #76 | Exceptional 98.3% |
| Delaware | 99.3 /100 | #77 | Exceptional 98.3% |
| Shoshone | 99.2 /100 | #78 | Exceptional 98.3% |
| Immigrants | Belgium | 99.2 /100 | #79 | Exceptional 98.3% |
| Immigrants | Lithuania | 99.2 /100 | #80 | Exceptional 98.3% |
| Icelanders | 99.2 /100 | #81 | Exceptional 98.3% |
| Potawatomi | 99.2 /100 | #82 | Exceptional 98.3% |
| Osage | 99.1 /100 | #83 | Exceptional 98.3% |
| Immigrants | Denmark | 99.1 /100 | #84 | Exceptional 98.3% |
| Immigrants | Sweden | 99.1 /100 | #85 | Exceptional 98.3% |
| Hopi | 99.0 /100 | #86 | Exceptional 98.3% |
| Immigrants | Australia | 99.0 /100 | #87 | Exceptional 98.3% |
| Ukrainians | 98.8 /100 | #88 | Exceptional 98.3% |