Immigrants from Bosnia and Herzegovina vs Marshallese Kindergarten
COMPARE
Immigrants from Bosnia and Herzegovina
Marshallese
Kindergarten
Kindergarten Comparison
Immigrants from Bosnia and Herzegovina
Marshallese
97.9%
KINDERGARTEN
46.7/ 100
METRIC RATING
180th/ 347
METRIC RANK
98.1%
KINDERGARTEN
83.0/ 100
METRIC RATING
141st/ 347
METRIC RANK
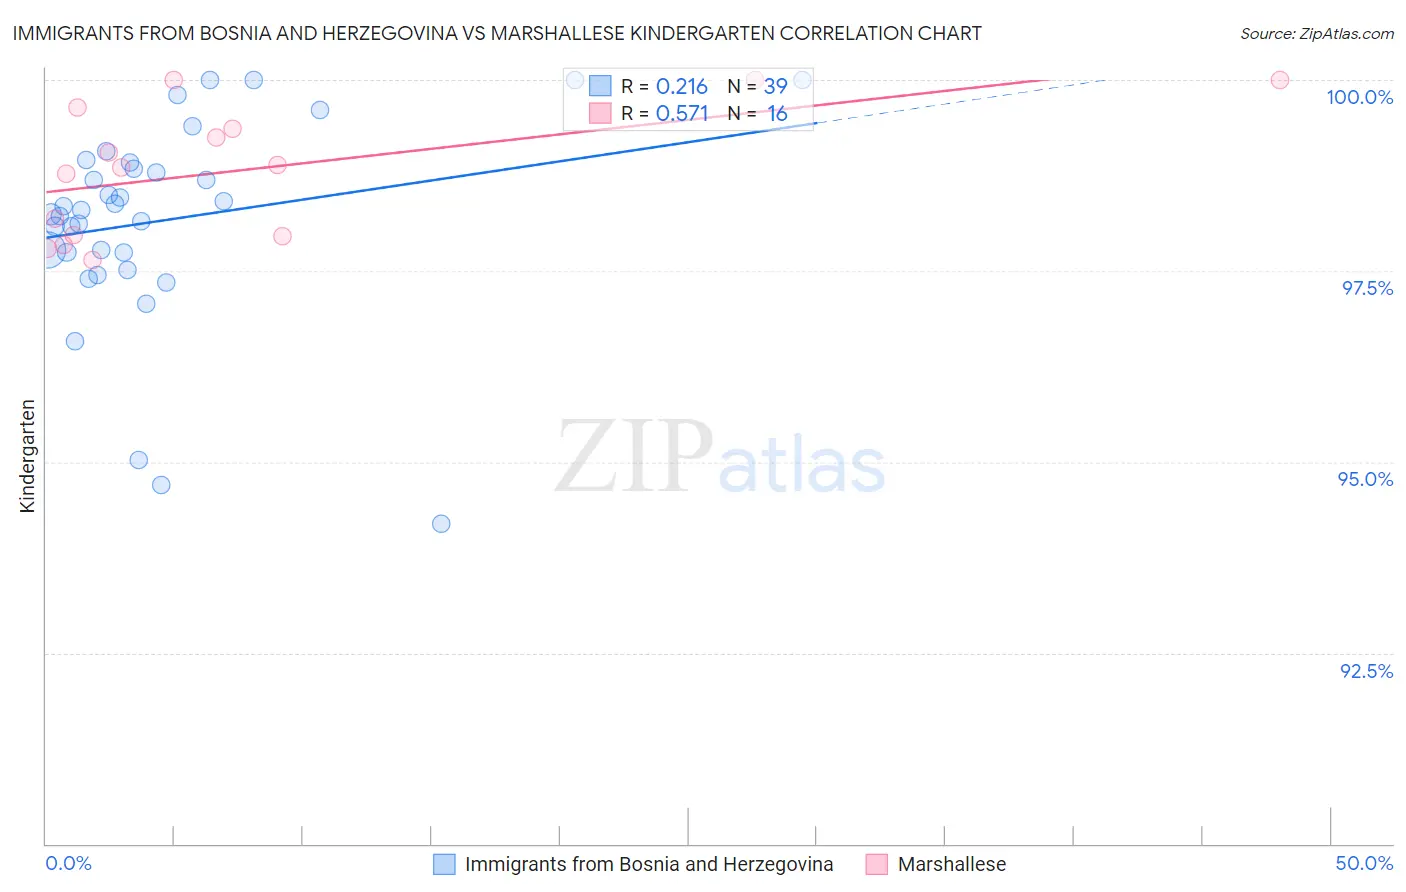
Immigrants from Bosnia and Herzegovina vs Marshallese Kindergarten Correlation Chart
The statistical analysis conducted on geographies consisting of 156,779,463 people shows a weak positive correlation between the proportion of Immigrants from Bosnia and Herzegovina and percentage of population with at least kindergarten education in the United States with a correlation coefficient (R) of 0.216 and weighted average of 97.9%. Similarly, the statistical analysis conducted on geographies consisting of 14,761,315 people shows a substantial positive correlation between the proportion of Marshallese and percentage of population with at least kindergarten education in the United States with a correlation coefficient (R) of 0.571 and weighted average of 98.1%, a difference of 0.13%.
Kindergarten Correlation Summary
| Measurement | Immigrants from Bosnia and Herzegovina | Marshallese |
| Minimum | 94.2% | 97.6% |
| Maximum | 100.0% | 100.0% |
| Range | 5.8% | 2.4% |
| Mean | 98.2% | 98.8% |
| Median | 98.3% | 98.9% |
| Interquartile 25% (IQ1) | 97.7% | 98.0% |
| Interquartile 75% (IQ3) | 98.9% | 99.5% |
| Interquartile Range (IQR) | 1.2% | 1.5% |
| Standard Deviation (Sample) | 1.3% | 0.84% |
| Standard Deviation (Population) | 1.3% | 0.82% |
Similar Demographics by Kindergarten
Demographics Similar to Immigrants from Bosnia and Herzegovina by Kindergarten
In terms of kindergarten, the demographic groups most similar to Immigrants from Bosnia and Herzegovina are Immigrants from Venezuela (97.9%, a difference of 0.0%), Brazilian (97.9%, a difference of 0.0%), Argentinean (97.9%, a difference of 0.0%), Kenyan (98.0%, a difference of 0.010%), and Immigrants from Brazil (98.0%, a difference of 0.010%).
| Demographics | Rating | Rank | Kindergarten |
| Kenyans | 51.0 /100 | #173 | Average 98.0% |
| Immigrants | Brazil | 50.0 /100 | #174 | Average 98.0% |
| Immigrants | Sri Lanka | 49.6 /100 | #175 | Average 97.9% |
| Albanians | 48.5 /100 | #176 | Average 97.9% |
| Immigrants | Venezuela | 47.9 /100 | #177 | Average 97.9% |
| Brazilians | 47.6 /100 | #178 | Average 97.9% |
| Argentineans | 46.8 /100 | #179 | Average 97.9% |
| Immigrants | Bosnia and Herzegovina | 46.7 /100 | #180 | Average 97.9% |
| Portuguese | 43.5 /100 | #181 | Average 97.9% |
| Egyptians | 42.4 /100 | #182 | Average 97.9% |
| Immigrants | Poland | 41.4 /100 | #183 | Average 97.9% |
| Immigrants | Argentina | 40.7 /100 | #184 | Average 97.9% |
| Immigrants | Belarus | 39.4 /100 | #185 | Fair 97.9% |
| Pakistanis | 36.0 /100 | #186 | Fair 97.9% |
| Immigrants | Kazakhstan | 35.9 /100 | #187 | Fair 97.9% |
Demographics Similar to Marshallese by Kindergarten
In terms of kindergarten, the demographic groups most similar to Marshallese are Palestinian (98.1%, a difference of 0.0%), Immigrants from Turkey (98.1%, a difference of 0.0%), Burmese (98.1%, a difference of 0.010%), Alsatian (98.1%, a difference of 0.010%), and Hmong (98.1%, a difference of 0.020%).
| Demographics | Rating | Rank | Kindergarten |
| Immigrants | Bulgaria | 89.4 /100 | #134 | Excellent 98.1% |
| Immigrants | Kuwait | 89.2 /100 | #135 | Excellent 98.1% |
| Immigrants | Hungary | 89.1 /100 | #136 | Excellent 98.1% |
| Blackfeet | 87.8 /100 | #137 | Excellent 98.1% |
| Immigrants | Romania | 87.7 /100 | #138 | Excellent 98.1% |
| Israelis | 87.7 /100 | #139 | Excellent 98.1% |
| Palestinians | 83.6 /100 | #140 | Excellent 98.1% |
| Marshallese | 83.0 /100 | #141 | Excellent 98.1% |
| Immigrants | Turkey | 82.8 /100 | #142 | Excellent 98.1% |
| Burmese | 81.5 /100 | #143 | Excellent 98.1% |
| Alsatians | 80.4 /100 | #144 | Excellent 98.1% |
| Hmong | 78.8 /100 | #145 | Good 98.1% |
| Filipinos | 78.3 /100 | #146 | Good 98.0% |
| Immigrants | Israel | 77.6 /100 | #147 | Good 98.0% |
| Apache | 75.0 /100 | #148 | Good 98.0% |