Immigrants from Philippines vs Scottish 1st Grade

COMPARE

Immigrants from Philippines
Race
Ancestry
AfghanAfricanAlaska NativeAlaskan AthabascanAlbanianAleutAlsatianAmericanApacheArabArapahoArgentineanArmenianAssyrian/Chaldean/SyriacAustralianAustrianBahamianBangladeshiBarbadianBasqueBelgianBelizeanBermudanBhutaneseBlackfeetBolivianBrazilianBritishBritish West IndianBulgarianBurmeseCajunCambodianCanadianCape VerdeanCarpatho RusynCelticCentral AmericanCentral American IndianCherokeeCheyenneChickasawChileanChineseChippewaChoctawColombianColvilleComancheCosta RicanCreeCreekCroatianCrowCubanCypriotCzechCzechoslovakianDanishDelawareDominicanDutchDutch West IndianEastern EuropeanEcuadorianEgyptianEnglishEstonianEthiopianEuropeanFijianFilipinoFinnishFrenchFrench American IndianFrench CanadianGermanGerman RussianGhanaianGreekGuamanian/ChamorroGuatemalanGuyaneseHaitianHmongHonduranHopiHoumaHungarianIcelanderIndian (Asian)IndonesianInupiatIranianIraqiIrishIroquoisIsraeliItalianJamaicanJapaneseJordanianKenyanKiowaKoreanLaotianLatvianLebaneseLiberianLithuanianLumbeeLuxembourgerMacedonianMalaysianMalteseMarshalleseMenomineeMexicanMexican American IndianMongolianMoroccanNative HawaiianNavajoNepaleseNew ZealanderNicaraguanNigerianNorthern EuropeanNorwegianOkinawanOsageOttawaPaiutePakistaniPalestinianPanamanianParaguayanPennsylvania GermanPeruvianPimaPolishPortuguesePotawatomiPuebloPuerto RicanPuget Sound SalishRomanianRussianSalvadoranSamoanScandinavianScotch-IrishSeminoleSenegaleseSerbianShoshoneSierra LeoneanSiouxSlavicSlovakSloveneSomaliSouth AfricanSouth AmericanSouth American IndianSoviet UnionSpaniardSpanishSpanish AmericanSpanish American IndianSri LankanSubsaharan AfricanSudaneseSwedishSwissSyrianTaiwaneseThaiTlingit-HaidaTohono O'OdhamTonganTrinidadian and TobagonianTsimshianTurkishU.S. Virgin IslanderUgandanUkrainianUruguayanUteVenezuelanVietnameseWelshWest IndianYakamaYaquiYugoslavianYumanYup'ikZimbabwean
Immigration
NonimmigrantsImmigrantsAfghanistanAfricaAlbaniaArgentinaArmeniaAsiaAustraliaAustriaBahamasBangladeshBarbadosBelarusBelgiumBelizeBoliviaBosnia and HerzegovinaBrazilBulgariaBurma/MyanmarCabo VerdeCambodiaCameroonCanadaCaribbeanCentral AmericaChileChinaColombiaCongoCosta RicaCroatiaCubaCzechoslovakiaDenmarkDominicaDominican RepublicEastern AfricaEastern AsiaEastern EuropeEcuadorEgyptEl SalvadorEnglandEritreaEthiopiaEuropeFijiFranceGermanyGhanaGreeceGrenadaGuatemalaGuyanaHaitiHondurasHong KongHungaryIndiaIndonesiaIranIraqIrelandIsraelItalyJamaicaJapanJordanKazakhstanKenyaKoreaKuwaitLaosLatin AmericaLatviaLebanonLiberiaLithuaniaMalaysiaMexicoMicronesiaMiddle AfricaMoldovaMoroccoNepalNetherlandsNicaraguaNigeriaNorth AmericaNorth MacedoniaNorthern AfricaNorthern EuropeNorwayOceaniaPakistanPanamaPeruPhilippinesPolandPortugalRomaniaRussiaSaudi ArabiaScotlandSenegalSerbiaSierra LeoneSingaporeSomaliaSouth AfricaSouth AmericaSouth Central AsiaSouth Eastern AsiaSouthern EuropeSpainSri LankaSt. Vincent and the GrenadinesSudanSwedenSwitzerlandSyriaTaiwanThailandTrinidad and TobagoTurkeyUgandaUkraineUruguayUzbekistanVenezuelaVietnamWest IndiesWestern AfricaWestern AsiaWestern EuropeYemenZaireZimbabweAzores
Scottish
Race
Ancestry
AfghanAfricanAlaska NativeAlaskan AthabascanAlbanianAleutAlsatianAmericanApacheArabArapahoArgentineanArmenianAssyrian/Chaldean/SyriacAustralianAustrianBahamianBangladeshiBarbadianBasqueBelgianBelizeanBermudanBhutaneseBlackfeetBolivianBrazilianBritishBritish West IndianBulgarianBurmeseCajunCambodianCanadianCape VerdeanCarpatho RusynCelticCentral AmericanCentral American IndianCherokeeCheyenneChickasawChileanChineseChippewaChoctawColombianColvilleComancheCosta RicanCreeCreekCroatianCrowCubanCypriotCzechCzechoslovakianDanishDelawareDominicanDutchDutch West IndianEastern EuropeanEcuadorianEgyptianEnglishEstonianEthiopianEuropeanFijianFilipinoFinnishFrenchFrench American IndianFrench CanadianGermanGerman RussianGhanaianGreekGuamanian/ChamorroGuatemalanGuyaneseHaitianHmongHonduranHopiHoumaHungarianIcelanderIndian (Asian)IndonesianInupiatIranianIraqiIrishIroquoisIsraeliItalianJamaicanJapaneseJordanianKenyanKiowaKoreanLaotianLatvianLebaneseLiberianLithuanianLumbeeLuxembourgerMacedonianMalaysianMalteseMarshalleseMenomineeMexicanMexican American IndianMongolianMoroccanNative HawaiianNavajoNepaleseNew ZealanderNicaraguanNigerianNorthern EuropeanNorwegianOkinawanOsageOttawaPaiutePakistaniPalestinianPanamanianParaguayanPennsylvania GermanPeruvianPimaPolishPortuguesePotawatomiPuebloPuerto RicanPuget Sound SalishRomanianRussianSalvadoranSamoanScandinavianScotch-IrishScottishSeminoleSenegaleseSerbianShoshoneSierra LeoneanSiouxSlavicSlovakSloveneSomaliSouth AfricanSouth AmericanSouth American IndianSoviet UnionSpaniardSpanishSpanish AmericanSpanish American IndianSri LankanSubsaharan AfricanSudaneseSwedishSwissSyrianTaiwaneseThaiTlingit-HaidaTohono O'OdhamTonganTrinidadian and TobagonianTsimshianTurkishU.S. Virgin IslanderUgandanUkrainianUruguayanUteVenezuelanVietnameseWelshWest IndianYakamaYaquiYugoslavianYumanYup'ikZimbabwean
Immigration
NonimmigrantsImmigrantsAfghanistanAfricaAlbaniaArgentinaArmeniaAsiaAustraliaAustriaBahamasBangladeshBarbadosBelarusBelgiumBelizeBoliviaBosnia and HerzegovinaBrazilBulgariaBurma/MyanmarCabo VerdeCambodiaCameroonCanadaCaribbeanCentral AmericaChileChinaColombiaCongoCosta RicaCroatiaCubaCzechoslovakiaDenmarkDominicaDominican RepublicEastern AfricaEastern AsiaEastern EuropeEcuadorEgyptEl SalvadorEnglandEritreaEthiopiaEuropeFijiFranceGermanyGhanaGreeceGrenadaGuatemalaGuyanaHaitiHondurasHong KongHungaryIndiaIndonesiaIranIraqIrelandIsraelItalyJamaicaJapanJordanKazakhstanKenyaKoreaKuwaitLaosLatin AmericaLatviaLebanonLiberiaLithuaniaMalaysiaMexicoMicronesiaMiddle AfricaMoldovaMoroccoNepalNetherlandsNicaraguaNigeriaNorth AmericaNorth MacedoniaNorthern AfricaNorthern EuropeNorwayOceaniaPakistanPanamaPeruPolandPortugalRomaniaRussiaSaudi ArabiaScotlandSenegalSerbiaSierra LeoneSingaporeSomaliaSouth AfricaSouth AmericaSouth Central AsiaSouth Eastern AsiaSouthern EuropeSpainSri LankaSt. Vincent and the GrenadinesSudanSwedenSwitzerlandSyriaTaiwanThailandTrinidad and TobagoTurkeyUgandaUkraineUruguayUzbekistanVenezuelaVietnamWest IndiesWestern AfricaWestern AsiaWestern EuropeYemenZaireZimbabweAzores
1st Grade
Income
Poverty
Unemployment
Labor Participation
Family Structure
Vehicle Availability
Education Level
Disability

1st Grade Comparison

Immigrants from Philippines

Scottish

Tragic
Exceptional
97.4%
1ST GRADE
0.1/ 100
METRIC RATING
276th/ 347
METRIC RANK
98.6%
1ST GRADE
100.0/ 100
METRIC RATING
17th/ 347
METRIC RANK

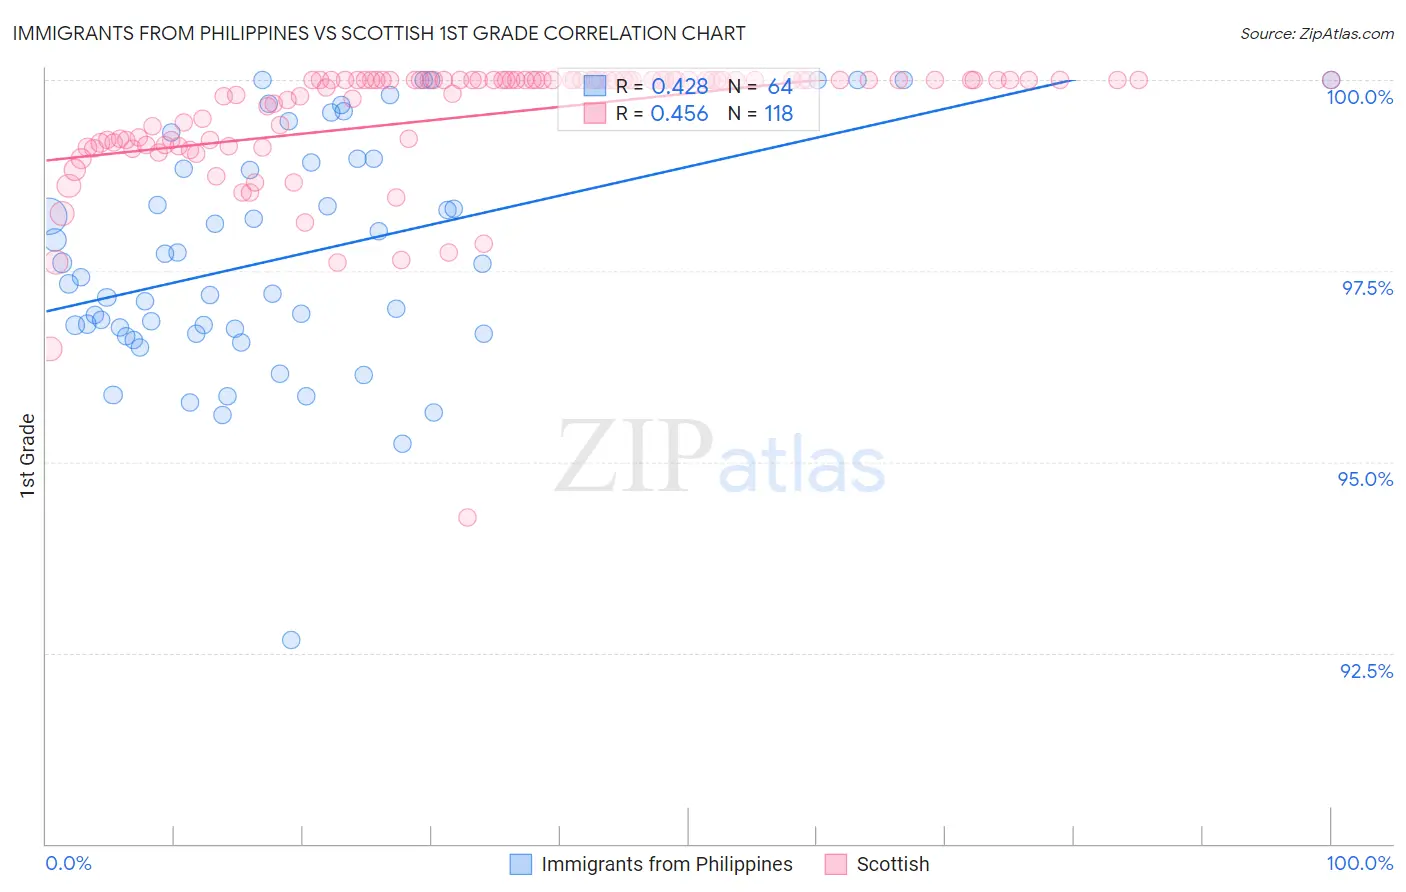
Immigrants from Philippines vs Scottish 1st Grade Correlation Chart

The statistical analysis conducted on geographies consisting of 471,303,140 people shows a moderate positive correlation between the proportion of Immigrants from Philippines and percentage of population with at least 1st grade education in the United States with a correlation coefficient (R) of 0.428 and weighted average of 97.4%. Similarly, the statistical analysis conducted on geographies consisting of 567,141,733 people shows a moderate positive correlation between the proportion of Scottish and percentage of population with at least 1st grade education in the United States with a correlation coefficient (R) of 0.456 and weighted average of 98.6%, a difference of 1.3%.
Immigrants from Philippines vs Scottish 1st Grade

1st Grade Correlation Summary

MeasurementImmigrants from PhilippinesScottish
Minimum92.7%94.3%
Maximum100.0%100.0%
Range7.3%5.7%
Mean97.7%99.5%
Median97.5%100.0%
Interquartile 25% (IQ1)96.7%99.2%
Interquartile 75% (IQ3)98.9%100.0%
Interquartile Range (IQR)2.2%0.82%
Standard Deviation (Sample)1.5%0.84%
Standard Deviation (Population)1.5%0.84%

Similar Demographics by 1st Grade

Demographics Similar to Immigrants from Philippines by 1st Grade

In terms of 1st grade, the demographic groups most similar to Immigrants from Philippines are Immigrants from Western Africa (97.4%, a difference of 0.010%), Ghanaian (97.4%, a difference of 0.020%), Immigrants from China (97.4%, a difference of 0.020%), Immigrants from Uzbekistan (97.4%, a difference of 0.030%), and Immigrants from Ghana (97.4%, a difference of 0.030%).
DemographicsRating | Rank1st Grade
West Indians
0.3
/100
|
#269
Tragic
97.5%
Immigrants | Jamaica
0.2
/100
|
#270
Tragic
97.5%
Immigrants | Cameroon
0.2
/100
|
#271
Tragic
97.4%
Immigrants | Peru
0.2
/100
|
#272
Tragic
97.4%
Immigrants | Bolivia
0.2
/100
|
#273
Tragic
97.4%
Ghanaians
0.1
/100
|
#274
Tragic
97.4%
Immigrants | China
0.1
/100
|
#275
Tragic
97.4%
Immigrants | Philippines
0.1
/100
|
#276
Tragic
97.4%
Immigrants | Western Africa
0.1
/100
|
#277
Tragic
97.4%
Immigrants | Uzbekistan
0.1
/100
|
#278
Tragic
97.4%
Immigrants | Ghana
0.1
/100
|
#279
Tragic
97.4%
Afghans
0.1
/100
|
#280
Tragic
97.4%
Trinidadians and Tobagonians
0.1
/100
|
#281
Tragic
97.3%
Barbadians
0.1
/100
|
#282
Tragic
97.3%
Immigrants | West Indies
0.0
/100
|
#283
Tragic
97.3%

Demographics Similar to Scottish by 1st Grade

In terms of 1st grade, the demographic groups most similar to Scottish are Aleut (98.6%, a difference of 0.0%), Swedish (98.6%, a difference of 0.010%), Dutch (98.6%, a difference of 0.010%), Carpatho Rusyn (98.6%, a difference of 0.030%), and English (98.6%, a difference of 0.030%).
DemographicsRating | Rank1st Grade
Germans
100.0
/100
|
#10
Exceptional
98.7%
Tlingit-Haida
100.0
/100
|
#11
Exceptional
98.7%
Slovenes
100.0
/100
|
#12
Exceptional
98.7%
Carpatho Rusyns
100.0
/100
|
#13
Exceptional
98.6%
English
100.0
/100
|
#14
Exceptional
98.6%
Swedes
100.0
/100
|
#15
Exceptional
98.6%
Aleuts
100.0
/100
|
#16
Exceptional
98.6%
Scottish
100.0
/100
|
#17
Exceptional
98.6%
Dutch
100.0
/100
|
#18
Exceptional
98.6%
Irish
100.0
/100
|
#19
Exceptional
98.6%
Sioux
100.0
/100
|
#20
Exceptional
98.6%
Arapaho
100.0
/100
|
#21
Exceptional
98.6%
Pennsylvania Germans
100.0
/100
|
#22
Exceptional
98.6%
Finns
100.0
/100
|
#23
Exceptional
98.6%
Lithuanians
100.0
/100
|
#24
Exceptional
98.6%