Immigrants from Philippines vs Immigrants from Ecuador 1st Grade
COMPARE
Immigrants from Philippines
Immigrants from Ecuador
1st Grade
1st Grade Comparison
Immigrants from Philippines
Immigrants from Ecuador
97.4%
1ST GRADE
0.1/ 100
METRIC RATING
276th/ 347
METRIC RANK
96.9%
1ST GRADE
0.0/ 100
METRIC RATING
316th/ 347
METRIC RANK
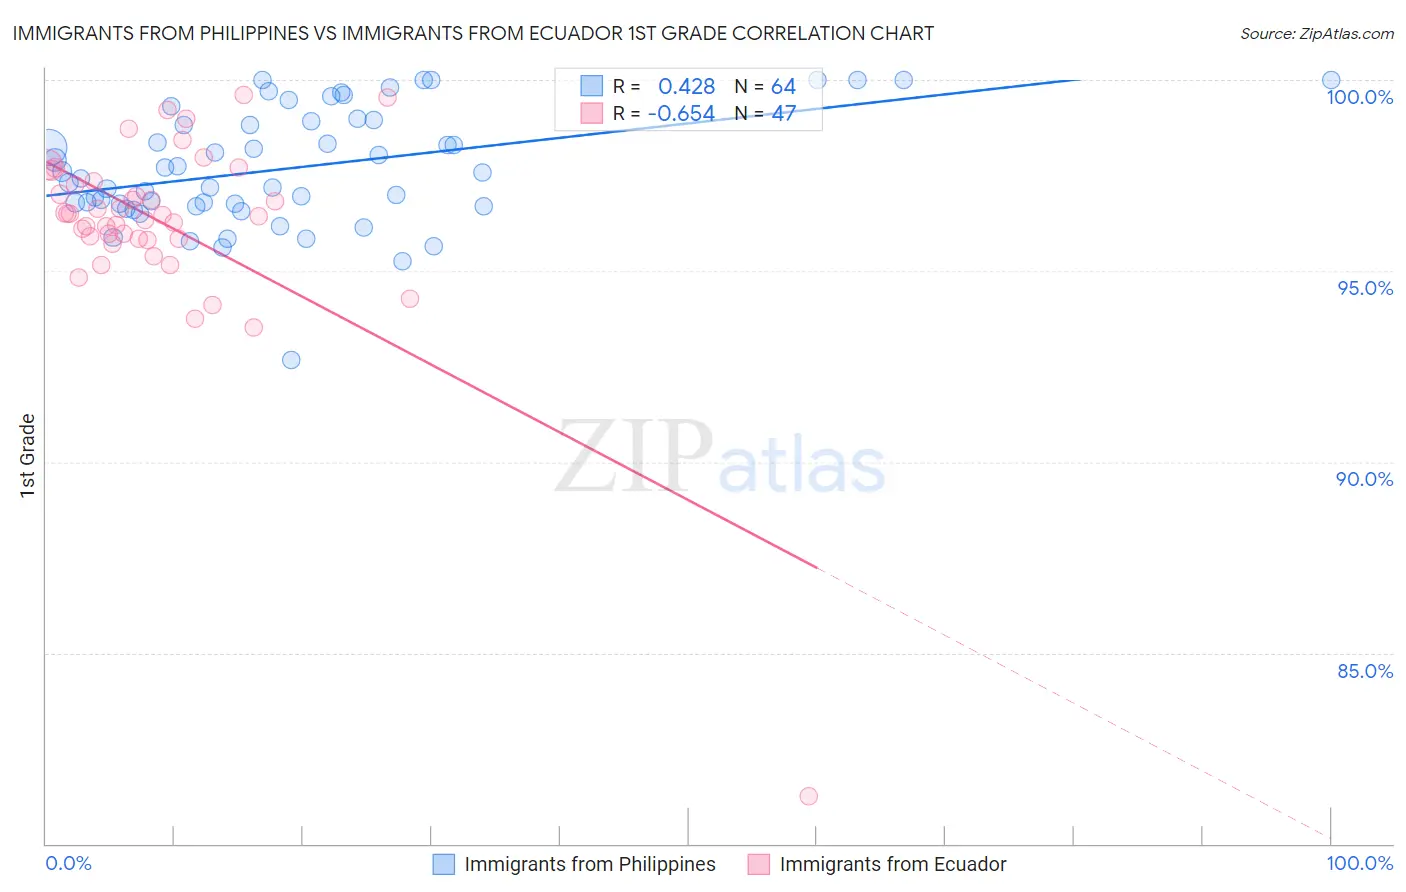
Immigrants from Philippines vs Immigrants from Ecuador 1st Grade Correlation Chart
The statistical analysis conducted on geographies consisting of 471,303,140 people shows a moderate positive correlation between the proportion of Immigrants from Philippines and percentage of population with at least 1st grade education in the United States with a correlation coefficient (R) of 0.428 and weighted average of 97.4%. Similarly, the statistical analysis conducted on geographies consisting of 271,020,679 people shows a significant negative correlation between the proportion of Immigrants from Ecuador and percentage of population with at least 1st grade education in the United States with a correlation coefficient (R) of -0.654 and weighted average of 96.9%, a difference of 0.55%.
1st Grade Correlation Summary
| Measurement | Immigrants from Philippines | Immigrants from Ecuador |
| Minimum | 92.7% | 81.2% |
| Maximum | 100.0% | 99.6% |
| Range | 7.3% | 18.3% |
| Mean | 97.7% | 96.3% |
| Median | 97.5% | 96.5% |
| Interquartile 25% (IQ1) | 96.7% | 95.8% |
| Interquartile 75% (IQ3) | 98.9% | 97.3% |
| Interquartile Range (IQR) | 2.2% | 1.5% |
| Standard Deviation (Sample) | 1.5% | 2.6% |
| Standard Deviation (Population) | 1.5% | 2.6% |
Similar Demographics by 1st Grade
Demographics Similar to Immigrants from Philippines by 1st Grade
In terms of 1st grade, the demographic groups most similar to Immigrants from Philippines are Immigrants from Western Africa (97.4%, a difference of 0.010%), Ghanaian (97.4%, a difference of 0.020%), Immigrants from China (97.4%, a difference of 0.020%), Immigrants from Uzbekistan (97.4%, a difference of 0.030%), and Immigrants from Ghana (97.4%, a difference of 0.030%).
| Demographics | Rating | Rank | 1st Grade |
| West Indians | 0.3 /100 | #269 | Tragic 97.5% |
| Immigrants | Jamaica | 0.2 /100 | #270 | Tragic 97.5% |
| Immigrants | Cameroon | 0.2 /100 | #271 | Tragic 97.4% |
| Immigrants | Peru | 0.2 /100 | #272 | Tragic 97.4% |
| Immigrants | Bolivia | 0.2 /100 | #273 | Tragic 97.4% |
| Ghanaians | 0.1 /100 | #274 | Tragic 97.4% |
| Immigrants | China | 0.1 /100 | #275 | Tragic 97.4% |
| Immigrants | Philippines | 0.1 /100 | #276 | Tragic 97.4% |
| Immigrants | Western Africa | 0.1 /100 | #277 | Tragic 97.4% |
| Immigrants | Uzbekistan | 0.1 /100 | #278 | Tragic 97.4% |
| Immigrants | Ghana | 0.1 /100 | #279 | Tragic 97.4% |
| Afghans | 0.1 /100 | #280 | Tragic 97.4% |
| Trinidadians and Tobagonians | 0.1 /100 | #281 | Tragic 97.3% |
| Barbadians | 0.1 /100 | #282 | Tragic 97.3% |
| Immigrants | West Indies | 0.0 /100 | #283 | Tragic 97.3% |
Demographics Similar to Immigrants from Ecuador by 1st Grade
In terms of 1st grade, the demographic groups most similar to Immigrants from Ecuador are Immigrants from Nicaragua (96.9%, a difference of 0.0%), Immigrants from Belize (96.9%, a difference of 0.010%), Honduran (96.9%, a difference of 0.020%), Cape Verdean (96.9%, a difference of 0.040%), and Guyanese (96.9%, a difference of 0.040%).
| Demographics | Rating | Rank | 1st Grade |
| Immigrants | Haiti | 0.0 /100 | #309 | Tragic 96.9% |
| Immigrants | Azores | 0.0 /100 | #310 | Tragic 96.9% |
| Sri Lankans | 0.0 /100 | #311 | Tragic 96.9% |
| Cape Verdeans | 0.0 /100 | #312 | Tragic 96.9% |
| Guyanese | 0.0 /100 | #313 | Tragic 96.9% |
| Hondurans | 0.0 /100 | #314 | Tragic 96.9% |
| Immigrants | Belize | 0.0 /100 | #315 | Tragic 96.9% |
| Immigrants | Ecuador | 0.0 /100 | #316 | Tragic 96.9% |
| Immigrants | Nicaragua | 0.0 /100 | #317 | Tragic 96.9% |
| Immigrants | Laos | 0.0 /100 | #318 | Tragic 96.8% |
| Immigrants | Guyana | 0.0 /100 | #319 | Tragic 96.8% |
| Immigrants | Burma/Myanmar | 0.0 /100 | #320 | Tragic 96.8% |
| Immigrants | Bangladesh | 0.0 /100 | #321 | Tragic 96.8% |
| Mexican American Indians | 0.0 /100 | #322 | Tragic 96.8% |
| Immigrants | Honduras | 0.0 /100 | #323 | Tragic 96.8% |