Immigrants from Peru vs Immigrants from Costa Rica 9th Grade
COMPARE
Immigrants from Peru
Immigrants from Costa Rica
9th Grade
9th Grade Comparison
Immigrants from Peru
Immigrants from Costa Rica
93.4%
9TH GRADE
0.0/ 100
METRIC RATING
285th/ 347
METRIC RANK
94.0%
9TH GRADE
0.5/ 100
METRIC RATING
257th/ 347
METRIC RANK
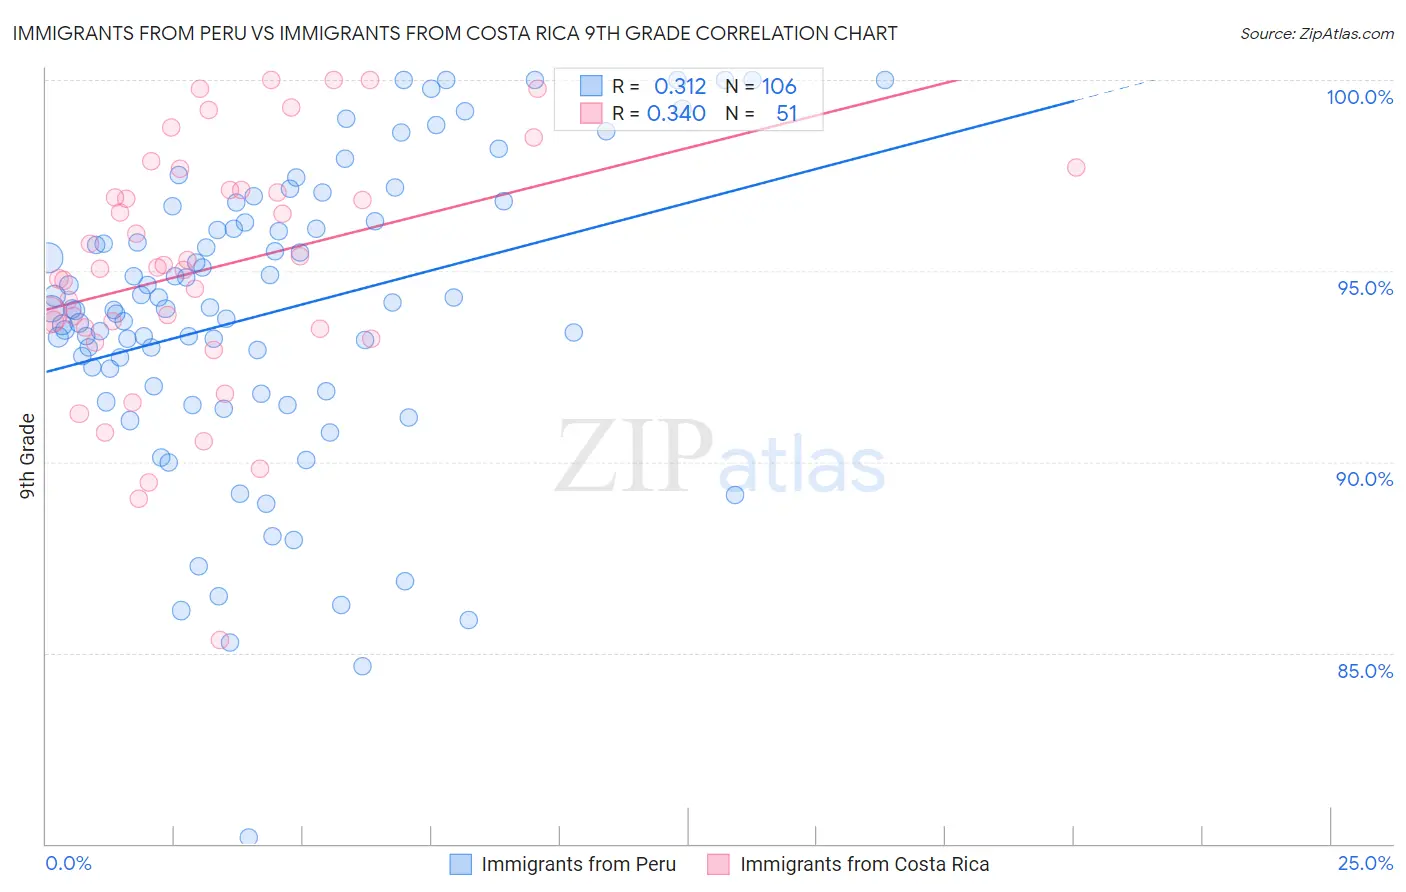
Immigrants from Peru vs Immigrants from Costa Rica 9th Grade Correlation Chart
The statistical analysis conducted on geographies consisting of 328,860,880 people shows a mild positive correlation between the proportion of Immigrants from Peru and percentage of population with at least 9th grade education in the United States with a correlation coefficient (R) of 0.312 and weighted average of 93.4%. Similarly, the statistical analysis conducted on geographies consisting of 204,277,241 people shows a mild positive correlation between the proportion of Immigrants from Costa Rica and percentage of population with at least 9th grade education in the United States with a correlation coefficient (R) of 0.340 and weighted average of 94.0%, a difference of 0.59%.
9th Grade Correlation Summary
| Measurement | Immigrants from Peru | Immigrants from Costa Rica |
| Minimum | 80.2% | 85.3% |
| Maximum | 100.0% | 100.0% |
| Range | 19.8% | 14.7% |
| Mean | 93.9% | 95.1% |
| Median | 94.0% | 95.1% |
| Interquartile 25% (IQ1) | 92.0% | 93.5% |
| Interquartile 75% (IQ3) | 96.3% | 97.1% |
| Interquartile Range (IQR) | 4.3% | 3.6% |
| Standard Deviation (Sample) | 3.9% | 3.2% |
| Standard Deviation (Population) | 3.8% | 3.2% |
Similar Demographics by 9th Grade
Demographics Similar to Immigrants from Peru by 9th Grade
In terms of 9th grade, the demographic groups most similar to Immigrants from Peru are Bangladeshi (93.4%, a difference of 0.040%), Immigrants from Barbados (93.4%, a difference of 0.040%), Immigrants from St. Vincent and the Grenadines (93.4%, a difference of 0.040%), Immigrants from South Eastern Asia (93.3%, a difference of 0.070%), and Barbadian (93.5%, a difference of 0.11%).
| Demographics | Rating | Rank | 9th Grade |
| Immigrants | Eritrea | 0.1 /100 | #278 | Tragic 93.7% |
| Trinidadians and Tobagonians | 0.1 /100 | #279 | Tragic 93.7% |
| Taiwanese | 0.1 /100 | #280 | Tragic 93.6% |
| Immigrants | Trinidad and Tobago | 0.1 /100 | #281 | Tragic 93.6% |
| Malaysians | 0.0 /100 | #282 | Tragic 93.5% |
| Barbadians | 0.0 /100 | #283 | Tragic 93.5% |
| Bangladeshis | 0.0 /100 | #284 | Tragic 93.4% |
| Immigrants | Peru | 0.0 /100 | #285 | Tragic 93.4% |
| Immigrants | Barbados | 0.0 /100 | #286 | Tragic 93.4% |
| Immigrants | St. Vincent and the Grenadines | 0.0 /100 | #287 | Tragic 93.4% |
| Immigrants | South Eastern Asia | 0.0 /100 | #288 | Tragic 93.3% |
| Immigrants | West Indies | 0.0 /100 | #289 | Tragic 93.3% |
| Pennsylvania Germans | 0.0 /100 | #290 | Tragic 93.3% |
| British West Indians | 0.0 /100 | #291 | Tragic 93.2% |
| Immigrants | Laos | 0.0 /100 | #292 | Tragic 93.2% |
Demographics Similar to Immigrants from Costa Rica by 9th Grade
In terms of 9th grade, the demographic groups most similar to Immigrants from Costa Rica are Immigrants from Thailand (93.9%, a difference of 0.010%), Ghanaian (93.9%, a difference of 0.010%), Immigrants from Afghanistan (94.0%, a difference of 0.020%), Pima (93.9%, a difference of 0.020%), and Immigrants from Nigeria (94.0%, a difference of 0.030%).
| Demographics | Rating | Rank | 9th Grade |
| Immigrants | Hong Kong | 1.3 /100 | #250 | Tragic 94.1% |
| Jamaicans | 1.0 /100 | #251 | Tragic 94.1% |
| Immigrants | Senegal | 0.9 /100 | #252 | Tragic 94.1% |
| Colombians | 0.8 /100 | #253 | Tragic 94.0% |
| U.S. Virgin Islanders | 0.7 /100 | #254 | Tragic 94.0% |
| Immigrants | Nigeria | 0.6 /100 | #255 | Tragic 94.0% |
| Immigrants | Afghanistan | 0.5 /100 | #256 | Tragic 94.0% |
| Immigrants | Costa Rica | 0.5 /100 | #257 | Tragic 94.0% |
| Immigrants | Thailand | 0.5 /100 | #258 | Tragic 93.9% |
| Ghanaians | 0.5 /100 | #259 | Tragic 93.9% |
| Pima | 0.4 /100 | #260 | Tragic 93.9% |
| South Americans | 0.4 /100 | #261 | Tragic 93.9% |
| Immigrants | Jamaica | 0.4 /100 | #262 | Tragic 93.9% |
| Immigrants | Uzbekistan | 0.4 /100 | #263 | Tragic 93.9% |
| Immigrants | Congo | 0.4 /100 | #264 | Tragic 93.9% |