Immigrants from Ireland vs Immigrants from Costa Rica 9th Grade
COMPARE
Immigrants from Ireland
Immigrants from Costa Rica
9th Grade
9th Grade Comparison
Immigrants from Ireland
Immigrants from Costa Rica
95.8%
9TH GRADE
99.6/ 100
METRIC RATING
68th/ 347
METRIC RANK
94.0%
9TH GRADE
0.5/ 100
METRIC RATING
257th/ 347
METRIC RANK
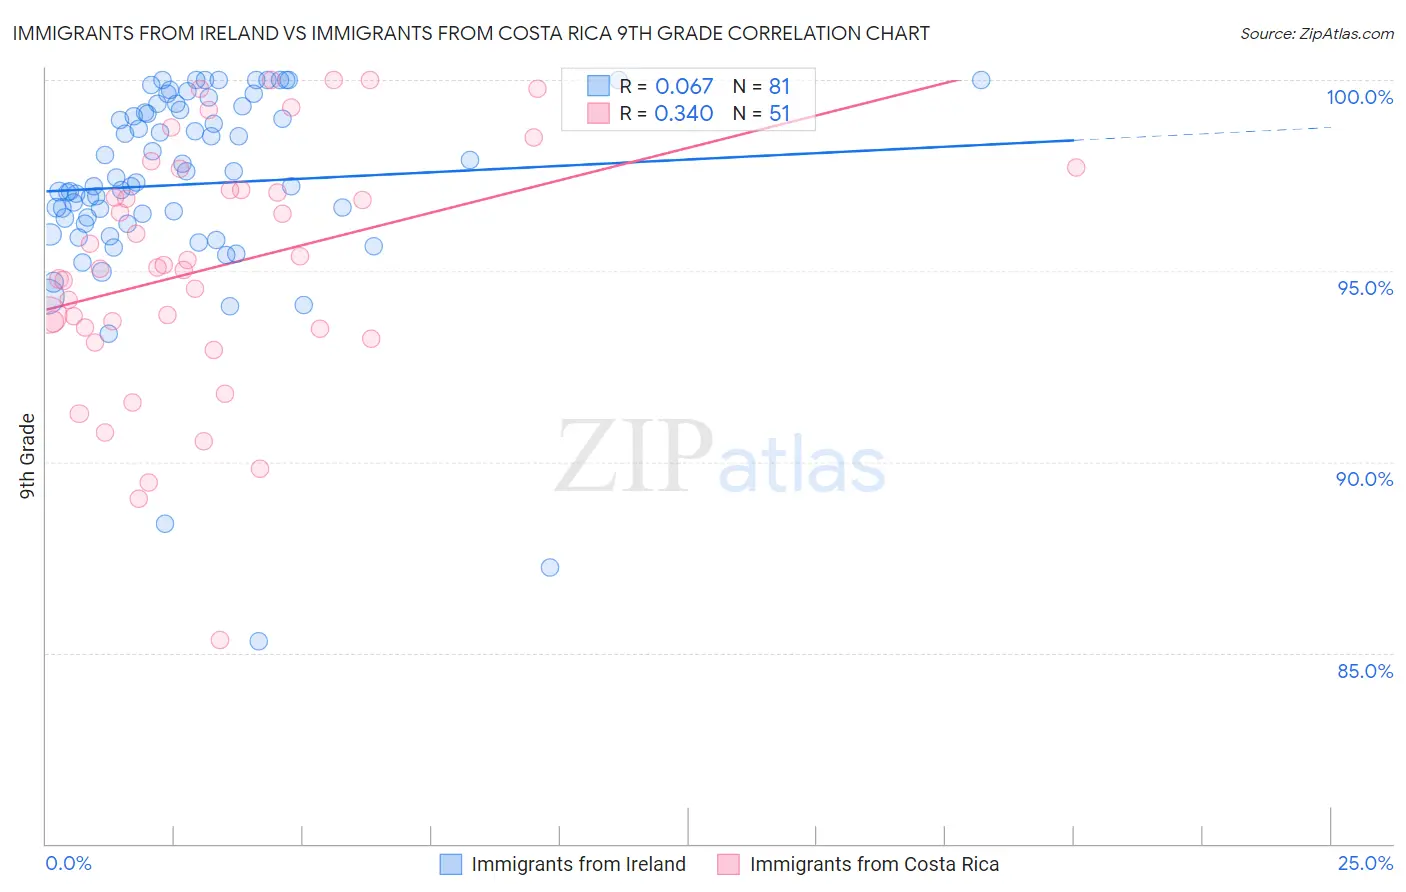
Immigrants from Ireland vs Immigrants from Costa Rica 9th Grade Correlation Chart
The statistical analysis conducted on geographies consisting of 240,784,498 people shows a slight positive correlation between the proportion of Immigrants from Ireland and percentage of population with at least 9th grade education in the United States with a correlation coefficient (R) of 0.067 and weighted average of 95.8%. Similarly, the statistical analysis conducted on geographies consisting of 204,277,241 people shows a mild positive correlation between the proportion of Immigrants from Costa Rica and percentage of population with at least 9th grade education in the United States with a correlation coefficient (R) of 0.340 and weighted average of 94.0%, a difference of 2.0%.
9th Grade Correlation Summary
| Measurement | Immigrants from Ireland | Immigrants from Costa Rica |
| Minimum | 85.3% | 85.3% |
| Maximum | 100.0% | 100.0% |
| Range | 14.7% | 14.7% |
| Mean | 97.3% | 95.1% |
| Median | 97.3% | 95.1% |
| Interquartile 25% (IQ1) | 96.2% | 93.5% |
| Interquartile 75% (IQ3) | 99.3% | 97.1% |
| Interquartile Range (IQR) | 3.0% | 3.6% |
| Standard Deviation (Sample) | 2.7% | 3.2% |
| Standard Deviation (Population) | 2.7% | 3.2% |
Similar Demographics by 9th Grade
Demographics Similar to Immigrants from Ireland by 9th Grade
In terms of 9th grade, the demographic groups most similar to Immigrants from Ireland are Cypriot (95.8%, a difference of 0.0%), Immigrants from Lithuania (95.8%, a difference of 0.0%), Immigrants from Netherlands (95.8%, a difference of 0.010%), Immigrants from Australia (95.8%, a difference of 0.020%), and Immigrants from Belgium (95.8%, a difference of 0.020%).
| Demographics | Rating | Rank | 9th Grade |
| Sioux | 99.8 /100 | #61 | Exceptional 95.9% |
| Ukrainians | 99.7 /100 | #62 | Exceptional 95.9% |
| Canadians | 99.7 /100 | #63 | Exceptional 95.9% |
| Zimbabweans | 99.7 /100 | #64 | Exceptional 95.9% |
| Immigrants | England | 99.6 /100 | #65 | Exceptional 95.9% |
| Immigrants | Netherlands | 99.6 /100 | #66 | Exceptional 95.8% |
| Cypriots | 99.6 /100 | #67 | Exceptional 95.8% |
| Immigrants | Ireland | 99.6 /100 | #68 | Exceptional 95.8% |
| Immigrants | Lithuania | 99.6 /100 | #69 | Exceptional 95.8% |
| Immigrants | Australia | 99.5 /100 | #70 | Exceptional 95.8% |
| Immigrants | Belgium | 99.5 /100 | #71 | Exceptional 95.8% |
| Turks | 99.5 /100 | #72 | Exceptional 95.8% |
| Immigrants | Singapore | 99.5 /100 | #73 | Exceptional 95.8% |
| Thais | 99.5 /100 | #74 | Exceptional 95.8% |
| Inupiat | 99.5 /100 | #75 | Exceptional 95.8% |
Demographics Similar to Immigrants from Costa Rica by 9th Grade
In terms of 9th grade, the demographic groups most similar to Immigrants from Costa Rica are Immigrants from Thailand (93.9%, a difference of 0.010%), Ghanaian (93.9%, a difference of 0.010%), Immigrants from Afghanistan (94.0%, a difference of 0.020%), Pima (93.9%, a difference of 0.020%), and Immigrants from Nigeria (94.0%, a difference of 0.030%).
| Demographics | Rating | Rank | 9th Grade |
| Immigrants | Hong Kong | 1.3 /100 | #250 | Tragic 94.1% |
| Jamaicans | 1.0 /100 | #251 | Tragic 94.1% |
| Immigrants | Senegal | 0.9 /100 | #252 | Tragic 94.1% |
| Colombians | 0.8 /100 | #253 | Tragic 94.0% |
| U.S. Virgin Islanders | 0.7 /100 | #254 | Tragic 94.0% |
| Immigrants | Nigeria | 0.6 /100 | #255 | Tragic 94.0% |
| Immigrants | Afghanistan | 0.5 /100 | #256 | Tragic 94.0% |
| Immigrants | Costa Rica | 0.5 /100 | #257 | Tragic 94.0% |
| Immigrants | Thailand | 0.5 /100 | #258 | Tragic 93.9% |
| Ghanaians | 0.5 /100 | #259 | Tragic 93.9% |
| Pima | 0.4 /100 | #260 | Tragic 93.9% |
| South Americans | 0.4 /100 | #261 | Tragic 93.9% |
| Immigrants | Jamaica | 0.4 /100 | #262 | Tragic 93.9% |
| Immigrants | Uzbekistan | 0.4 /100 | #263 | Tragic 93.9% |
| Immigrants | Congo | 0.4 /100 | #264 | Tragic 93.9% |