Immigrants from Australia vs Fijian 2nd Grade
COMPARE
Immigrants from Australia
Fijian
2nd Grade
2nd Grade Comparison
Immigrants from Australia
Fijians
98.2%
2ND GRADE
99.0/ 100
METRIC RATING
86th/ 347
METRIC RANK
97.5%
2ND GRADE
0.5/ 100
METRIC RATING
259th/ 347
METRIC RANK
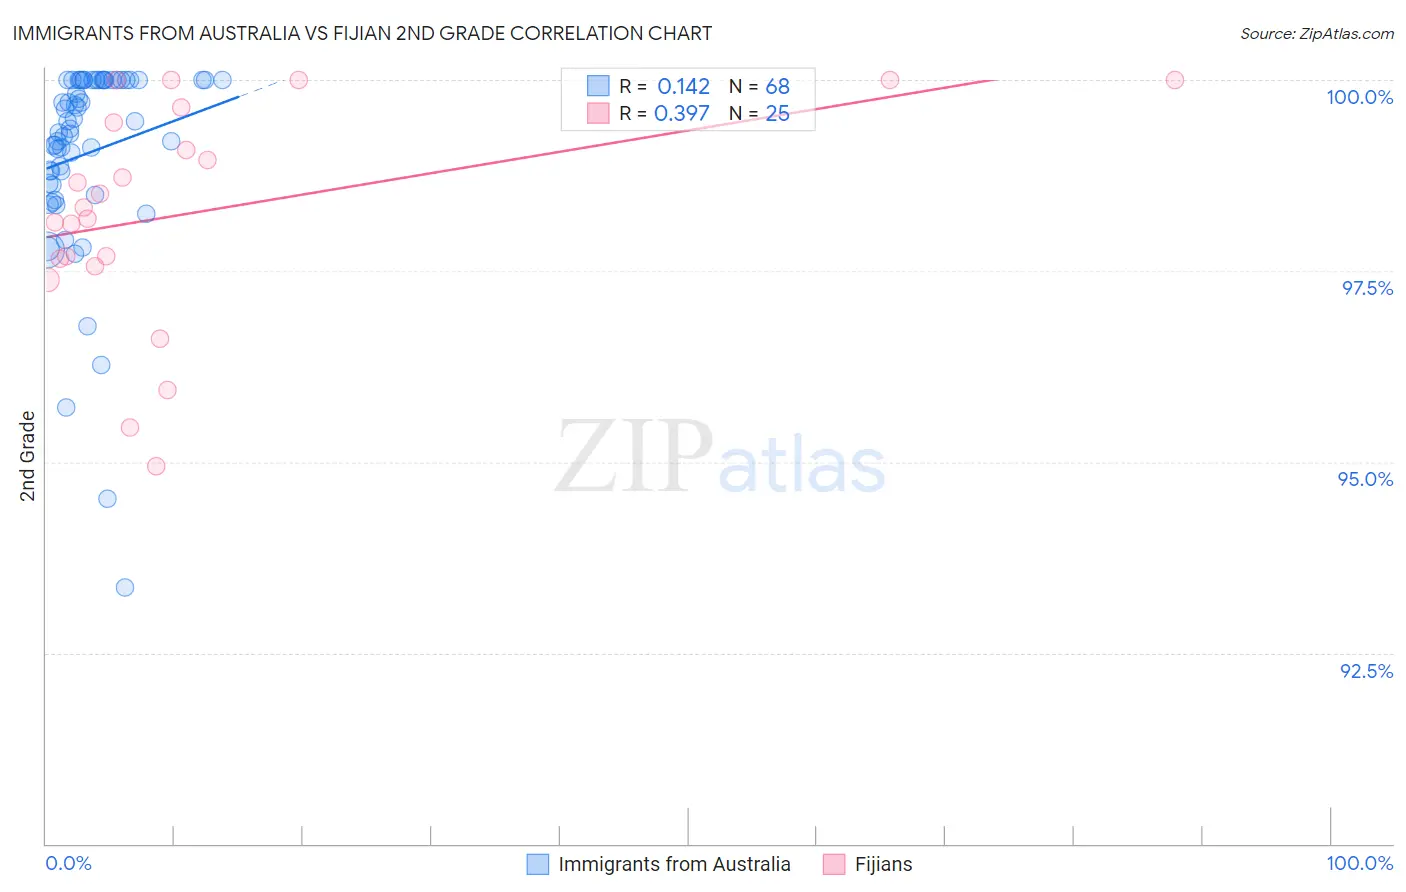
Immigrants from Australia vs Fijian 2nd Grade Correlation Chart
The statistical analysis conducted on geographies consisting of 227,203,469 people shows a poor positive correlation between the proportion of Immigrants from Australia and percentage of population with at least 2nd grade education in the United States with a correlation coefficient (R) of 0.142 and weighted average of 98.2%. Similarly, the statistical analysis conducted on geographies consisting of 55,948,842 people shows a mild positive correlation between the proportion of Fijians and percentage of population with at least 2nd grade education in the United States with a correlation coefficient (R) of 0.397 and weighted average of 97.5%, a difference of 0.78%.
2nd Grade Correlation Summary
| Measurement | Immigrants from Australia | Fijian |
| Minimum | 93.4% | 94.9% |
| Maximum | 100.0% | 100.0% |
| Range | 6.6% | 5.1% |
| Mean | 99.0% | 98.3% |
| Median | 99.4% | 98.3% |
| Interquartile 25% (IQ1) | 98.6% | 97.6% |
| Interquartile 75% (IQ3) | 100.0% | 99.5% |
| Interquartile Range (IQR) | 1.4% | 1.9% |
| Standard Deviation (Sample) | 1.3% | 1.4% |
| Standard Deviation (Population) | 1.3% | 1.4% |
Similar Demographics by 2nd Grade
Demographics Similar to Immigrants from Australia by 2nd Grade
In terms of 2nd grade, the demographic groups most similar to Immigrants from Australia are Potawatomi (98.2%, a difference of 0.0%), Immigrants from Denmark (98.2%, a difference of 0.0%), Macedonian (98.2%, a difference of 0.0%), Icelander (98.2%, a difference of 0.010%), and Delaware (98.2%, a difference of 0.010%).
| Demographics | Rating | Rank | 2nd Grade |
| Immigrants | Belgium | 99.3 /100 | #79 | Exceptional 98.2% |
| Osage | 99.2 /100 | #80 | Exceptional 98.2% |
| Icelanders | 99.2 /100 | #81 | Exceptional 98.2% |
| Delaware | 99.1 /100 | #82 | Exceptional 98.2% |
| Immigrants | Sweden | 99.1 /100 | #83 | Exceptional 98.2% |
| Hopi | 99.1 /100 | #84 | Exceptional 98.2% |
| Potawatomi | 99.1 /100 | #85 | Exceptional 98.2% |
| Immigrants | Australia | 99.0 /100 | #86 | Exceptional 98.2% |
| Immigrants | Denmark | 99.0 /100 | #87 | Exceptional 98.2% |
| Macedonians | 99.0 /100 | #88 | Exceptional 98.2% |
| Ukrainians | 98.9 /100 | #89 | Exceptional 98.2% |
| Zimbabweans | 98.8 /100 | #90 | Exceptional 98.2% |
| Immigrants | Western Europe | 98.8 /100 | #91 | Exceptional 98.2% |
| Immigrants | South Africa | 98.8 /100 | #92 | Exceptional 98.2% |
| Immigrants | India | 98.8 /100 | #93 | Exceptional 98.2% |
Demographics Similar to Fijians by 2nd Grade
In terms of 2nd grade, the demographic groups most similar to Fijians are Yaqui (97.5%, a difference of 0.0%), Assyrian/Chaldean/Syriac (97.5%, a difference of 0.0%), Immigrants from Congo (97.5%, a difference of 0.010%), Jamaican (97.5%, a difference of 0.010%), and Immigrants from Colombia (97.5%, a difference of 0.010%).
| Demographics | Rating | Rank | 2nd Grade |
| Immigrants | Asia | 0.7 /100 | #252 | Tragic 97.5% |
| Puerto Ricans | 0.7 /100 | #253 | Tragic 97.5% |
| Indians (Asian) | 0.6 /100 | #254 | Tragic 97.5% |
| Immigrants | Congo | 0.6 /100 | #255 | Tragic 97.5% |
| Jamaicans | 0.6 /100 | #256 | Tragic 97.5% |
| Immigrants | Colombia | 0.5 /100 | #257 | Tragic 97.5% |
| Yaqui | 0.5 /100 | #258 | Tragic 97.5% |
| Fijians | 0.5 /100 | #259 | Tragic 97.5% |
| Assyrians/Chaldeans/Syriacs | 0.5 /100 | #260 | Tragic 97.5% |
| Armenians | 0.5 /100 | #261 | Tragic 97.5% |
| Taiwanese | 0.4 /100 | #262 | Tragic 97.4% |
| Immigrants | Ethiopia | 0.4 /100 | #263 | Tragic 97.4% |
| Immigrants | Liberia | 0.4 /100 | #264 | Tragic 97.4% |
| Immigrants | South America | 0.4 /100 | #265 | Tragic 97.4% |
| Immigrants | Sierra Leone | 0.4 /100 | #266 | Tragic 97.4% |