Immigrants from Peru vs Alsatian Unemployment Among Ages 55 to 59 years
COMPARE
Immigrants from Peru
Alsatian
Unemployment Among Ages 55 to 59 years
Unemployment Among Ages 55 to 59 years Comparison
Immigrants from Peru
Alsatians
4.8%
UNEMPLOYMENT AMONG AGES 55 TO 59 YEARS
38.6/ 100
METRIC RATING
183rd/ 347
METRIC RANK
5.2%
UNEMPLOYMENT AMONG AGES 55 TO 59 YEARS
0.0/ 100
METRIC RATING
279th/ 347
METRIC RANK
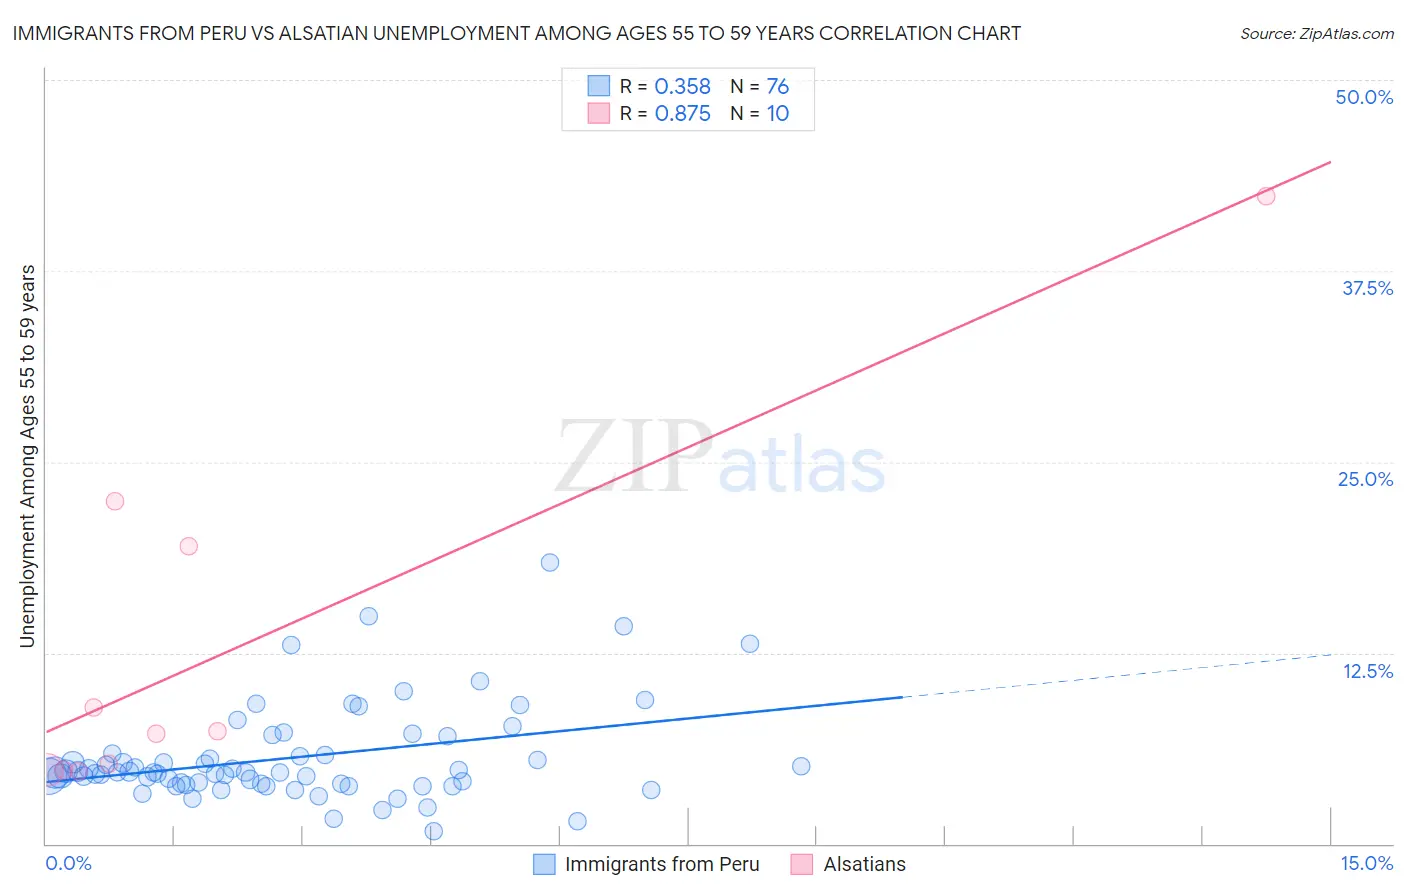
Immigrants from Peru vs Alsatian Unemployment Among Ages 55 to 59 years Correlation Chart
The statistical analysis conducted on geographies consisting of 313,256,453 people shows a mild positive correlation between the proportion of Immigrants from Peru and unemployment rate among population between the ages 55 and 59 in the United States with a correlation coefficient (R) of 0.358 and weighted average of 4.8%. Similarly, the statistical analysis conducted on geographies consisting of 80,463,292 people shows a very strong positive correlation between the proportion of Alsatians and unemployment rate among population between the ages 55 and 59 in the United States with a correlation coefficient (R) of 0.875 and weighted average of 5.2%, a difference of 8.3%.
Unemployment Among Ages 55 to 59 years Correlation Summary
| Measurement | Immigrants from Peru | Alsatian |
| Minimum | 0.80% | 4.7% |
| Maximum | 18.4% | 42.4% |
| Range | 17.6% | 37.7% |
| Mean | 5.6% | 12.7% |
| Median | 4.7% | 7.3% |
| Interquartile 25% (IQ1) | 3.9% | 4.8% |
| Interquartile 75% (IQ3) | 5.9% | 19.5% |
| Interquartile Range (IQR) | 1.9% | 14.7% |
| Standard Deviation (Sample) | 3.1% | 12.2% |
| Standard Deviation (Population) | 3.1% | 11.6% |
Similar Demographics by Unemployment Among Ages 55 to 59 years
Demographics Similar to Immigrants from Peru by Unemployment Among Ages 55 to 59 years
In terms of unemployment among ages 55 to 59 years, the demographic groups most similar to Immigrants from Peru are Immigrants from Czechoslovakia (4.8%, a difference of 0.020%), Immigrants from Hungary (4.8%, a difference of 0.070%), Immigrants from Europe (4.8%, a difference of 0.070%), Peruvian (4.8%, a difference of 0.070%), and Osage (4.8%, a difference of 0.070%).
| Demographics | Rating | Rank | Unemployment Among Ages 55 to 59 years |
| Samoans | 47.1 /100 | #176 | Average 4.8% |
| Immigrants | Sri Lanka | 46.8 /100 | #177 | Average 4.8% |
| Arabs | 44.7 /100 | #178 | Average 4.8% |
| Hungarians | 44.3 /100 | #179 | Average 4.8% |
| South Americans | 44.0 /100 | #180 | Average 4.8% |
| Immigrants | Hungary | 40.4 /100 | #181 | Average 4.8% |
| Immigrants | Europe | 40.4 /100 | #182 | Average 4.8% |
| Immigrants | Peru | 38.6 /100 | #183 | Fair 4.8% |
| Immigrants | Czechoslovakia | 38.0 /100 | #184 | Fair 4.8% |
| Peruvians | 37.0 /100 | #185 | Fair 4.8% |
| Osage | 37.0 /100 | #186 | Fair 4.8% |
| Immigrants | Morocco | 36.5 /100 | #187 | Fair 4.8% |
| Immigrants | Eastern Asia | 36.1 /100 | #188 | Fair 4.8% |
| Iroquois | 34.5 /100 | #189 | Fair 4.9% |
| Russians | 33.9 /100 | #190 | Fair 4.9% |
Demographics Similar to Alsatians by Unemployment Among Ages 55 to 59 years
In terms of unemployment among ages 55 to 59 years, the demographic groups most similar to Alsatians are Immigrants from Barbados (5.2%, a difference of 0.11%), Immigrants from Uzbekistan (5.3%, a difference of 0.21%), Immigrants from Latin America (5.2%, a difference of 0.29%), Guatemalan (5.3%, a difference of 0.36%), and West Indian (5.2%, a difference of 0.41%).
| Demographics | Rating | Rank | Unemployment Among Ages 55 to 59 years |
| Immigrants | Jamaica | 0.0 /100 | #272 | Tragic 5.2% |
| Ottawa | 0.0 /100 | #273 | Tragic 5.2% |
| Mexican American Indians | 0.0 /100 | #274 | Tragic 5.2% |
| Israelis | 0.0 /100 | #275 | Tragic 5.2% |
| West Indians | 0.0 /100 | #276 | Tragic 5.2% |
| Immigrants | Latin America | 0.0 /100 | #277 | Tragic 5.2% |
| Immigrants | Barbados | 0.0 /100 | #278 | Tragic 5.2% |
| Alsatians | 0.0 /100 | #279 | Tragic 5.2% |
| Immigrants | Uzbekistan | 0.0 /100 | #280 | Tragic 5.3% |
| Guatemalans | 0.0 /100 | #281 | Tragic 5.3% |
| Immigrants | Trinidad and Tobago | 0.0 /100 | #282 | Tragic 5.3% |
| Apache | 0.0 /100 | #283 | Tragic 5.3% |
| Ghanaians | 0.0 /100 | #284 | Tragic 5.3% |
| Armenians | 0.0 /100 | #285 | Tragic 5.3% |
| Immigrants | Ghana | 0.0 /100 | #286 | Tragic 5.3% |