Immigrants from Panama vs Yakama Family Poverty
COMPARE
Immigrants from Panama
Yakama
Family Poverty
Family Poverty Comparison
Immigrants from Panama
Yakama
10.0%
FAMILY POVERTY
3.1/ 100
METRIC RATING
230th/ 347
METRIC RANK
13.1%
FAMILY POVERTY
0.0/ 100
METRIC RATING
327th/ 347
METRIC RANK
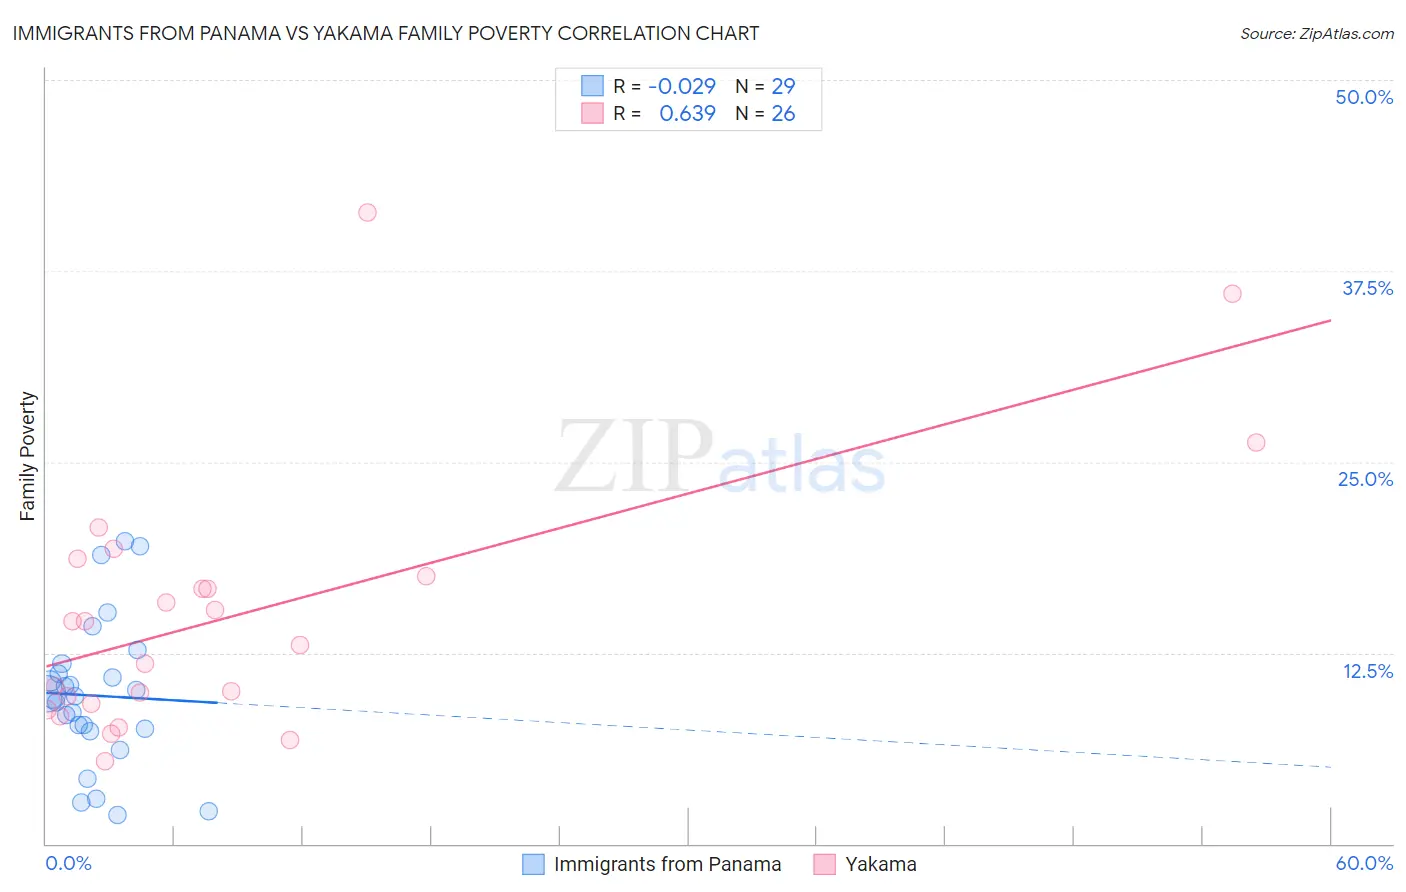
Immigrants from Panama vs Yakama Family Poverty Correlation Chart
The statistical analysis conducted on geographies consisting of 220,994,048 people shows no correlation between the proportion of Immigrants from Panama and poverty level among families in the United States with a correlation coefficient (R) of -0.029 and weighted average of 10.0%. Similarly, the statistical analysis conducted on geographies consisting of 19,913,351 people shows a significant positive correlation between the proportion of Yakama and poverty level among families in the United States with a correlation coefficient (R) of 0.639 and weighted average of 13.1%, a difference of 30.6%.
Family Poverty Correlation Summary
| Measurement | Immigrants from Panama | Yakama |
| Minimum | 1.9% | 5.4% |
| Maximum | 19.8% | 41.3% |
| Range | 17.9% | 35.9% |
| Mean | 9.7% | 15.1% |
| Median | 9.7% | 13.8% |
| Interquartile 25% (IQ1) | 7.4% | 9.1% |
| Interquartile 75% (IQ3) | 11.5% | 17.5% |
| Interquartile Range (IQR) | 4.0% | 8.4% |
| Standard Deviation (Sample) | 4.7% | 8.6% |
| Standard Deviation (Population) | 4.6% | 8.4% |
Similar Demographics by Family Poverty
Demographics Similar to Immigrants from Panama by Family Poverty
In terms of family poverty, the demographic groups most similar to Immigrants from Panama are Immigrants from Uzbekistan (10.0%, a difference of 0.020%), Sudanese (10.0%, a difference of 0.030%), Immigrants from Armenia (10.0%, a difference of 0.23%), Ottawa (10.0%, a difference of 0.25%), and Alaskan Athabascan (10.1%, a difference of 0.38%).
| Demographics | Rating | Rank | Family Poverty |
| Immigrants | Africa | 4.3 /100 | #223 | Tragic 9.9% |
| Marshallese | 3.9 /100 | #224 | Tragic 9.9% |
| Immigrants | Immigrants | 3.6 /100 | #225 | Tragic 10.0% |
| Ottawa | 3.3 /100 | #226 | Tragic 10.0% |
| Immigrants | Armenia | 3.3 /100 | #227 | Tragic 10.0% |
| Sudanese | 3.1 /100 | #228 | Tragic 10.0% |
| Immigrants | Uzbekistan | 3.1 /100 | #229 | Tragic 10.0% |
| Immigrants | Panama | 3.1 /100 | #230 | Tragic 10.0% |
| Alaskan Athabascans | 2.7 /100 | #231 | Tragic 10.1% |
| Immigrants | Sudan | 2.3 /100 | #232 | Tragic 10.1% |
| Fijians | 2.1 /100 | #233 | Tragic 10.1% |
| Immigrants | Middle Africa | 2.1 /100 | #234 | Tragic 10.1% |
| Nigerians | 2.0 /100 | #235 | Tragic 10.1% |
| Immigrants | Nigeria | 1.9 /100 | #236 | Tragic 10.2% |
| Immigrants | Laos | 1.7 /100 | #237 | Tragic 10.2% |
Demographics Similar to Yakama by Family Poverty
In terms of family poverty, the demographic groups most similar to Yakama are Colville (13.0%, a difference of 0.68%), Paiute (13.0%, a difference of 0.75%), Central American Indian (13.3%, a difference of 1.7%), Black/African American (13.3%, a difference of 1.8%), and Immigrants from Dominica (12.7%, a difference of 2.7%).
| Demographics | Rating | Rank | Family Poverty |
| Inupiat | 0.0 /100 | #320 | Tragic 12.5% |
| Arapaho | 0.0 /100 | #321 | Tragic 12.7% |
| Immigrants | Honduras | 0.0 /100 | #322 | Tragic 12.7% |
| Menominee | 0.0 /100 | #323 | Tragic 12.7% |
| Immigrants | Dominica | 0.0 /100 | #324 | Tragic 12.7% |
| Paiute | 0.0 /100 | #325 | Tragic 13.0% |
| Colville | 0.0 /100 | #326 | Tragic 13.0% |
| Yakama | 0.0 /100 | #327 | Tragic 13.1% |
| Central American Indians | 0.0 /100 | #328 | Tragic 13.3% |
| Blacks/African Americans | 0.0 /100 | #329 | Tragic 13.3% |
| Natives/Alaskans | 0.0 /100 | #330 | Tragic 14.3% |
| Cheyenne | 0.0 /100 | #331 | Tragic 14.3% |
| Dominicans | 0.0 /100 | #332 | Tragic 14.3% |
| Immigrants | Dominican Republic | 0.0 /100 | #333 | Tragic 14.4% |
| Houma | 0.0 /100 | #334 | Tragic 14.6% |