Immigrants from Panama vs Palestinian 3rd Grade
COMPARE
Immigrants from Panama
Palestinian
3rd Grade
3rd Grade Comparison
Immigrants from Panama
Palestinians
97.5%
3RD GRADE
5.2/ 100
METRIC RATING
219th/ 347
METRIC RANK
97.9%
3RD GRADE
84.6/ 100
METRIC RATING
140th/ 347
METRIC RANK
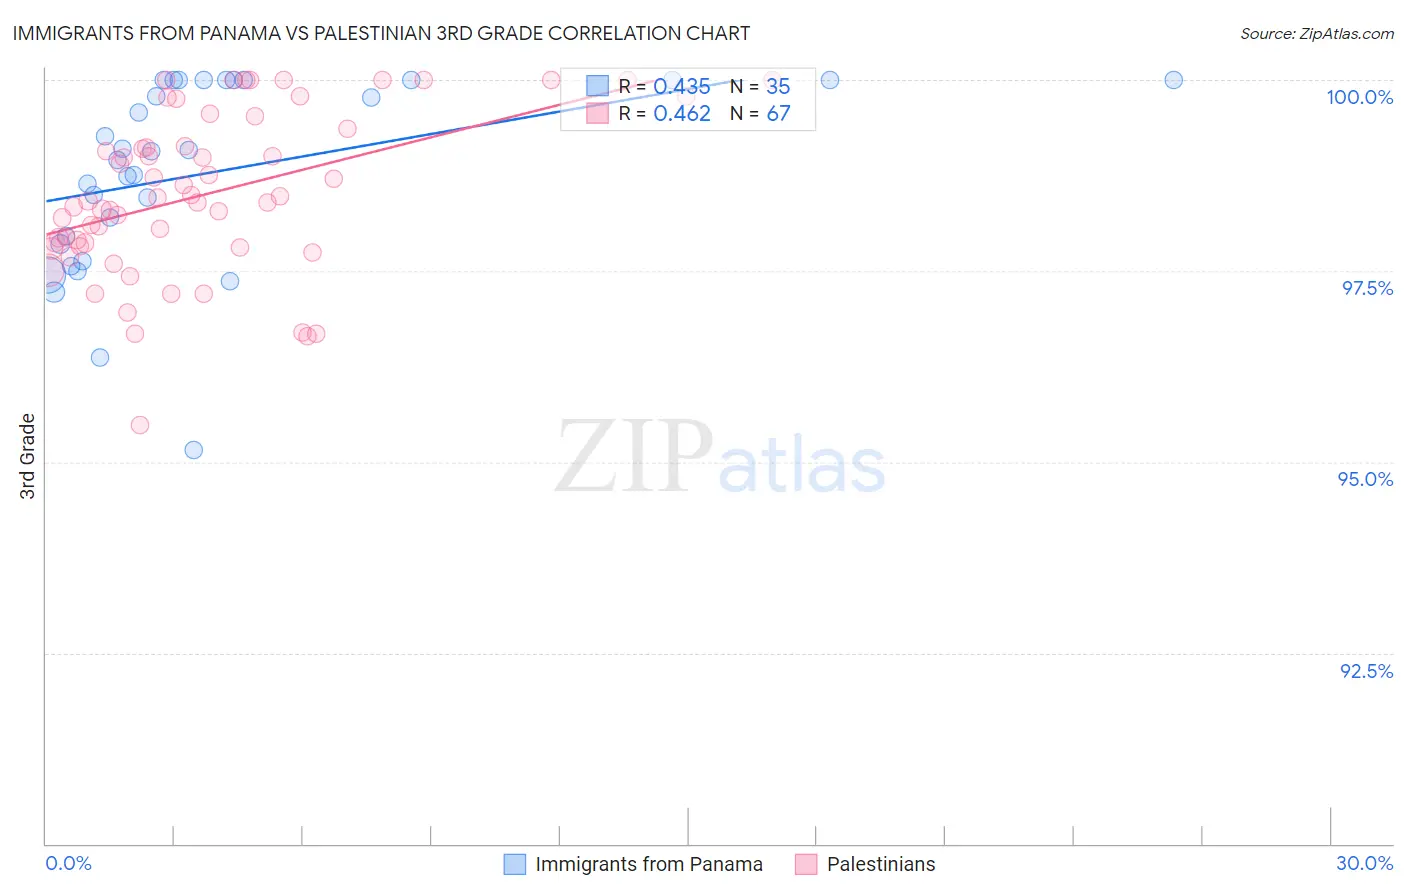
Immigrants from Panama vs Palestinian 3rd Grade Correlation Chart
The statistical analysis conducted on geographies consisting of 221,182,871 people shows a moderate positive correlation between the proportion of Immigrants from Panama and percentage of population with at least 3rd grade education in the United States with a correlation coefficient (R) of 0.435 and weighted average of 97.5%. Similarly, the statistical analysis conducted on geographies consisting of 216,457,008 people shows a moderate positive correlation between the proportion of Palestinians and percentage of population with at least 3rd grade education in the United States with a correlation coefficient (R) of 0.462 and weighted average of 97.9%, a difference of 0.39%.
3rd Grade Correlation Summary
| Measurement | Immigrants from Panama | Palestinian |
| Minimum | 95.1% | 95.5% |
| Maximum | 100.0% | 100.0% |
| Range | 4.9% | 4.5% |
| Mean | 98.8% | 98.5% |
| Median | 99.1% | 98.4% |
| Interquartile 25% (IQ1) | 97.9% | 97.8% |
| Interquartile 75% (IQ3) | 100.0% | 99.4% |
| Interquartile Range (IQR) | 2.1% | 1.5% |
| Standard Deviation (Sample) | 1.2% | 1.1% |
| Standard Deviation (Population) | 1.2% | 1.0% |
Similar Demographics by 3rd Grade
Demographics Similar to Immigrants from Panama by 3rd Grade
In terms of 3rd grade, the demographic groups most similar to Immigrants from Panama are Immigrants from Nepal (97.5%, a difference of 0.0%), Immigrants from Morocco (97.5%, a difference of 0.0%), Uruguayan (97.5%, a difference of 0.0%), South American Indian (97.5%, a difference of 0.010%), and Sierra Leonean (97.5%, a difference of 0.010%).
| Demographics | Rating | Rank | 3rd Grade |
| Immigrants | Bahamas | 8.5 /100 | #212 | Tragic 97.6% |
| Moroccans | 8.5 /100 | #213 | Tragic 97.6% |
| Yuman | 8.4 /100 | #214 | Tragic 97.6% |
| Iraqis | 6.9 /100 | #215 | Tragic 97.5% |
| Samoans | 6.9 /100 | #216 | Tragic 97.5% |
| South American Indians | 5.7 /100 | #217 | Tragic 97.5% |
| Immigrants | Nepal | 5.3 /100 | #218 | Tragic 97.5% |
| Immigrants | Panama | 5.2 /100 | #219 | Tragic 97.5% |
| Immigrants | Morocco | 5.0 /100 | #220 | Tragic 97.5% |
| Uruguayans | 5.0 /100 | #221 | Tragic 97.5% |
| Sierra Leoneans | 4.6 /100 | #222 | Tragic 97.5% |
| Immigrants | Syria | 4.4 /100 | #223 | Tragic 97.5% |
| Bahamians | 4.4 /100 | #224 | Tragic 97.5% |
| Tongans | 4.3 /100 | #225 | Tragic 97.5% |
| Sudanese | 4.1 /100 | #226 | Tragic 97.5% |
Demographics Similar to Palestinians by 3rd Grade
In terms of 3rd grade, the demographic groups most similar to Palestinians are Israeli (97.9%, a difference of 0.010%), Blackfeet (97.9%, a difference of 0.010%), Immigrants from Turkey (97.9%, a difference of 0.010%), Spaniard (97.9%, a difference of 0.020%), and Immigrants from Romania (97.9%, a difference of 0.020%).
| Demographics | Rating | Rank | 3rd Grade |
| Immigrants | Kuwait | 88.7 /100 | #133 | Excellent 97.9% |
| Seminole | 88.7 /100 | #134 | Excellent 97.9% |
| Cambodians | 88.1 /100 | #135 | Excellent 97.9% |
| Spaniards | 87.9 /100 | #136 | Excellent 97.9% |
| Immigrants | Romania | 87.9 /100 | #137 | Excellent 97.9% |
| Israelis | 86.6 /100 | #138 | Excellent 97.9% |
| Blackfeet | 86.3 /100 | #139 | Excellent 97.9% |
| Palestinians | 84.6 /100 | #140 | Excellent 97.9% |
| Immigrants | Turkey | 83.5 /100 | #141 | Excellent 97.9% |
| Hmong | 80.3 /100 | #142 | Excellent 97.9% |
| Filipinos | 79.9 /100 | #143 | Good 97.9% |
| Burmese | 79.6 /100 | #144 | Good 97.9% |
| Immigrants | Greece | 79.5 /100 | #145 | Good 97.9% |
| Alsatians | 78.3 /100 | #146 | Good 97.9% |
| Immigrants | Israel | 77.3 /100 | #147 | Good 97.9% |