Immigrants from India vs Palestinian 3rd Grade
COMPARE
Immigrants from India
Palestinian
3rd Grade
3rd Grade Comparison
Immigrants from India
Palestinians
98.1%
3RD GRADE
98.8/ 100
METRIC RATING
88th/ 347
METRIC RANK
97.9%
3RD GRADE
84.6/ 100
METRIC RATING
140th/ 347
METRIC RANK
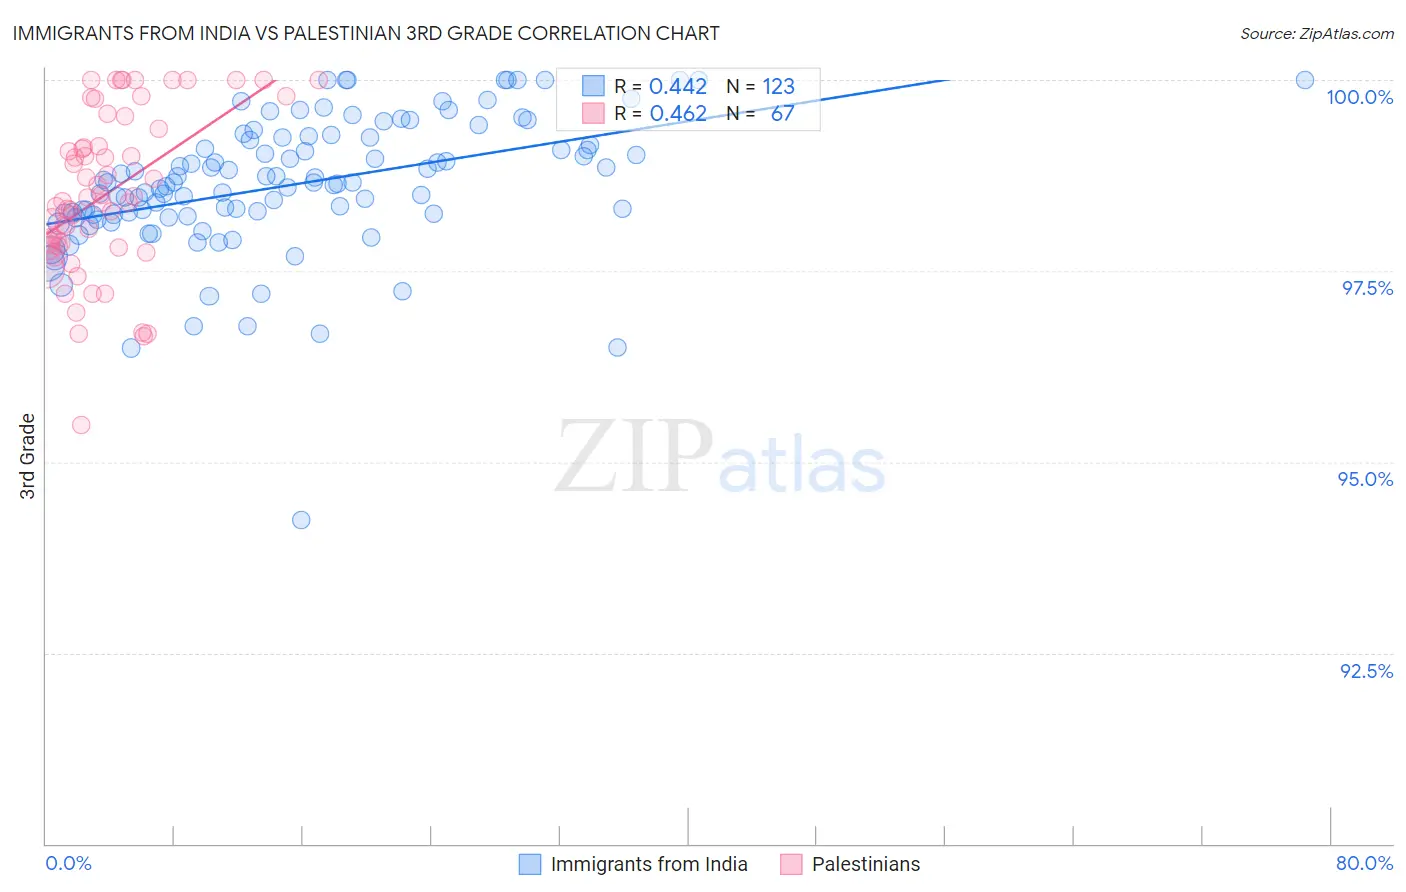
Immigrants from India vs Palestinian 3rd Grade Correlation Chart
The statistical analysis conducted on geographies consisting of 434,105,844 people shows a moderate positive correlation between the proportion of Immigrants from India and percentage of population with at least 3rd grade education in the United States with a correlation coefficient (R) of 0.442 and weighted average of 98.1%. Similarly, the statistical analysis conducted on geographies consisting of 216,457,008 people shows a moderate positive correlation between the proportion of Palestinians and percentage of population with at least 3rd grade education in the United States with a correlation coefficient (R) of 0.462 and weighted average of 97.9%, a difference of 0.23%.
3rd Grade Correlation Summary
| Measurement | Immigrants from India | Palestinian |
| Minimum | 94.2% | 95.5% |
| Maximum | 100.0% | 100.0% |
| Range | 5.8% | 4.5% |
| Mean | 98.6% | 98.5% |
| Median | 98.7% | 98.4% |
| Interquartile 25% (IQ1) | 98.2% | 97.8% |
| Interquartile 75% (IQ3) | 99.2% | 99.4% |
| Interquartile Range (IQR) | 1.0% | 1.5% |
| Standard Deviation (Sample) | 0.89% | 1.1% |
| Standard Deviation (Population) | 0.89% | 1.0% |
Similar Demographics by 3rd Grade
Demographics Similar to Immigrants from India by 3rd Grade
In terms of 3rd grade, the demographic groups most similar to Immigrants from India are Immigrants from Sweden (98.1%, a difference of 0.0%), Immigrants from Australia (98.1%, a difference of 0.0%), Potawatomi (98.1%, a difference of 0.0%), Immigrants from Denmark (98.1%, a difference of 0.0%), and Delaware (98.1%, a difference of 0.0%).
| Demographics | Rating | Rank | 3rd Grade |
| Icelanders | 99.1 /100 | #81 | Exceptional 98.1% |
| Shoshone | 99.0 /100 | #82 | Exceptional 98.1% |
| Ukrainians | 98.9 /100 | #83 | Exceptional 98.1% |
| Immigrants | Sweden | 98.9 /100 | #84 | Exceptional 98.1% |
| Immigrants | Australia | 98.9 /100 | #85 | Exceptional 98.1% |
| Potawatomi | 98.9 /100 | #86 | Exceptional 98.1% |
| Immigrants | Denmark | 98.8 /100 | #87 | Exceptional 98.1% |
| Immigrants | India | 98.8 /100 | #88 | Exceptional 98.1% |
| Delaware | 98.8 /100 | #89 | Exceptional 98.1% |
| Zimbabweans | 98.8 /100 | #90 | Exceptional 98.1% |
| Hopi | 98.7 /100 | #91 | Exceptional 98.1% |
| Immigrants | South Africa | 98.7 /100 | #92 | Exceptional 98.1% |
| Immigrants | Western Europe | 98.7 /100 | #93 | Exceptional 98.1% |
| Immigrants | Germany | 98.4 /100 | #94 | Exceptional 98.1% |
| Cypriots | 98.4 /100 | #95 | Exceptional 98.1% |
Demographics Similar to Palestinians by 3rd Grade
In terms of 3rd grade, the demographic groups most similar to Palestinians are Israeli (97.9%, a difference of 0.010%), Blackfeet (97.9%, a difference of 0.010%), Immigrants from Turkey (97.9%, a difference of 0.010%), Spaniard (97.9%, a difference of 0.020%), and Immigrants from Romania (97.9%, a difference of 0.020%).
| Demographics | Rating | Rank | 3rd Grade |
| Immigrants | Kuwait | 88.7 /100 | #133 | Excellent 97.9% |
| Seminole | 88.7 /100 | #134 | Excellent 97.9% |
| Cambodians | 88.1 /100 | #135 | Excellent 97.9% |
| Spaniards | 87.9 /100 | #136 | Excellent 97.9% |
| Immigrants | Romania | 87.9 /100 | #137 | Excellent 97.9% |
| Israelis | 86.6 /100 | #138 | Excellent 97.9% |
| Blackfeet | 86.3 /100 | #139 | Excellent 97.9% |
| Palestinians | 84.6 /100 | #140 | Excellent 97.9% |
| Immigrants | Turkey | 83.5 /100 | #141 | Excellent 97.9% |
| Hmong | 80.3 /100 | #142 | Excellent 97.9% |
| Filipinos | 79.9 /100 | #143 | Good 97.9% |
| Burmese | 79.6 /100 | #144 | Good 97.9% |
| Immigrants | Greece | 79.5 /100 | #145 | Good 97.9% |
| Alsatians | 78.3 /100 | #146 | Good 97.9% |
| Immigrants | Israel | 77.3 /100 | #147 | Good 97.9% |