Colombian vs Central American Professional Degree
COMPARE
Colombian
Central American
Professional Degree
Professional Degree Comparison
Colombians
Central Americans
4.6%
PROFESSIONAL DEGREE
77.7/ 100
METRIC RATING
147th/ 347
METRIC RANK
3.6%
PROFESSIONAL DEGREE
0.6/ 100
METRIC RATING
270th/ 347
METRIC RANK
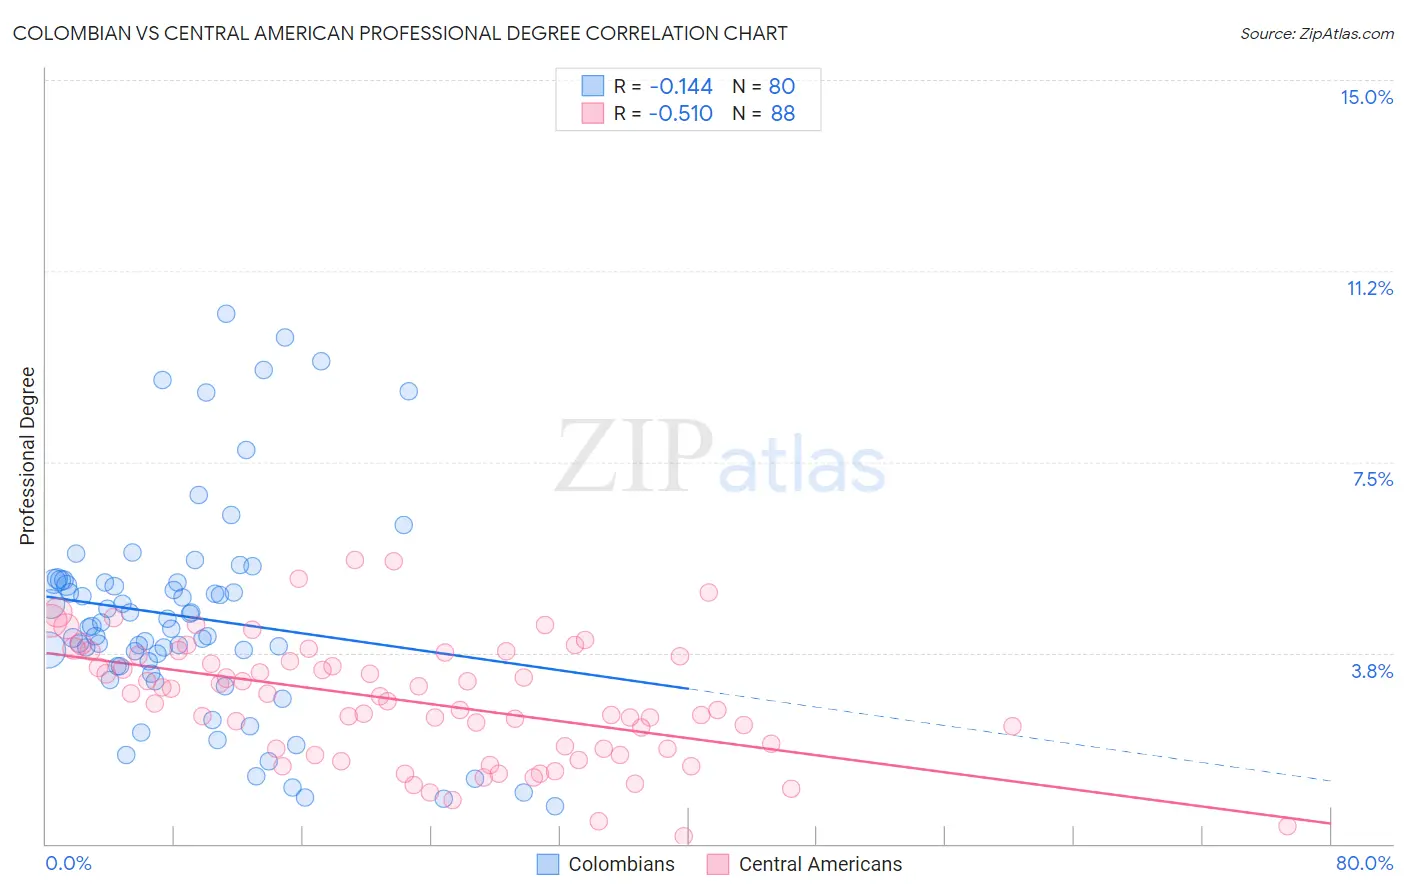
Colombian vs Central American Professional Degree Correlation Chart
The statistical analysis conducted on geographies consisting of 418,695,587 people shows a poor negative correlation between the proportion of Colombians and percentage of population with at least professional degree education in the United States with a correlation coefficient (R) of -0.144 and weighted average of 4.6%. Similarly, the statistical analysis conducted on geographies consisting of 501,496,781 people shows a substantial negative correlation between the proportion of Central Americans and percentage of population with at least professional degree education in the United States with a correlation coefficient (R) of -0.510 and weighted average of 3.6%, a difference of 28.5%.
Professional Degree Correlation Summary
| Measurement | Colombian | Central American |
| Minimum | 0.74% | 0.14% |
| Maximum | 10.4% | 5.6% |
| Range | 9.7% | 5.4% |
| Mean | 4.5% | 2.8% |
| Median | 4.3% | 2.8% |
| Interquartile 25% (IQ1) | 3.5% | 1.9% |
| Interquartile 75% (IQ3) | 5.1% | 3.7% |
| Interquartile Range (IQR) | 1.7% | 1.8% |
| Standard Deviation (Sample) | 2.1% | 1.2% |
| Standard Deviation (Population) | 2.1% | 1.2% |
Similar Demographics by Professional Degree
Demographics Similar to Colombians by Professional Degree
In terms of professional degree, the demographic groups most similar to Colombians are Luxembourger (4.6%, a difference of 0.21%), Slovene (4.6%, a difference of 0.32%), Senegalese (4.6%, a difference of 0.46%), Uruguayan (4.6%, a difference of 0.53%), and Immigrants from South America (4.6%, a difference of 0.58%).
| Demographics | Rating | Rank | Professional Degree |
| Canadians | 84.4 /100 | #140 | Excellent 4.7% |
| Basques | 81.8 /100 | #141 | Excellent 4.6% |
| Sudanese | 81.3 /100 | #142 | Excellent 4.6% |
| Hungarians | 80.8 /100 | #143 | Excellent 4.6% |
| Immigrants | South America | 80.5 /100 | #144 | Excellent 4.6% |
| Uruguayans | 80.2 /100 | #145 | Excellent 4.6% |
| Luxembourgers | 78.7 /100 | #146 | Good 4.6% |
| Colombians | 77.7 /100 | #147 | Good 4.6% |
| Slovenes | 76.1 /100 | #148 | Good 4.6% |
| Senegalese | 75.3 /100 | #149 | Good 4.6% |
| Immigrants | Oceania | 73.4 /100 | #150 | Good 4.6% |
| Poles | 72.6 /100 | #151 | Good 4.6% |
| Immigrants | Africa | 72.5 /100 | #152 | Good 4.6% |
| Immigrants | Uruguay | 72.5 /100 | #153 | Good 4.6% |
| Scottish | 71.8 /100 | #154 | Good 4.6% |
Demographics Similar to Central Americans by Professional Degree
In terms of professional degree, the demographic groups most similar to Central Americans are Immigrants from Cuba (3.6%, a difference of 0.29%), Belizean (3.6%, a difference of 0.47%), Immigrants from Jamaica (3.6%, a difference of 0.49%), American (3.6%, a difference of 0.56%), and Potawatomi (3.6%, a difference of 0.69%).
| Demographics | Rating | Rank | Professional Degree |
| Hopi | 0.9 /100 | #263 | Tragic 3.6% |
| Immigrants | Cambodia | 0.9 /100 | #264 | Tragic 3.6% |
| Immigrants | Congo | 0.8 /100 | #265 | Tragic 3.6% |
| Central American Indians | 0.8 /100 | #266 | Tragic 3.6% |
| Delaware | 0.7 /100 | #267 | Tragic 3.6% |
| Aleuts | 0.7 /100 | #268 | Tragic 3.6% |
| Immigrants | Cuba | 0.6 /100 | #269 | Tragic 3.6% |
| Central Americans | 0.6 /100 | #270 | Tragic 3.6% |
| Belizeans | 0.5 /100 | #271 | Tragic 3.6% |
| Immigrants | Jamaica | 0.5 /100 | #272 | Tragic 3.6% |
| Americans | 0.5 /100 | #273 | Tragic 3.6% |
| Potawatomi | 0.5 /100 | #274 | Tragic 3.6% |
| Immigrants | Dominica | 0.5 /100 | #275 | Tragic 3.6% |
| Liberians | 0.5 /100 | #276 | Tragic 3.6% |
| Cheyenne | 0.5 /100 | #277 | Tragic 3.6% |