Immigrants from Panama vs Afghan Professional Degree
COMPARE
Immigrants from Panama
Afghan
Professional Degree
Professional Degree Comparison
Immigrants from Panama
Afghans
4.1%
PROFESSIONAL DEGREE
12.3/ 100
METRIC RATING
209th/ 347
METRIC RANK
4.7%
PROFESSIONAL DEGREE
88.8/ 100
METRIC RATING
138th/ 347
METRIC RANK
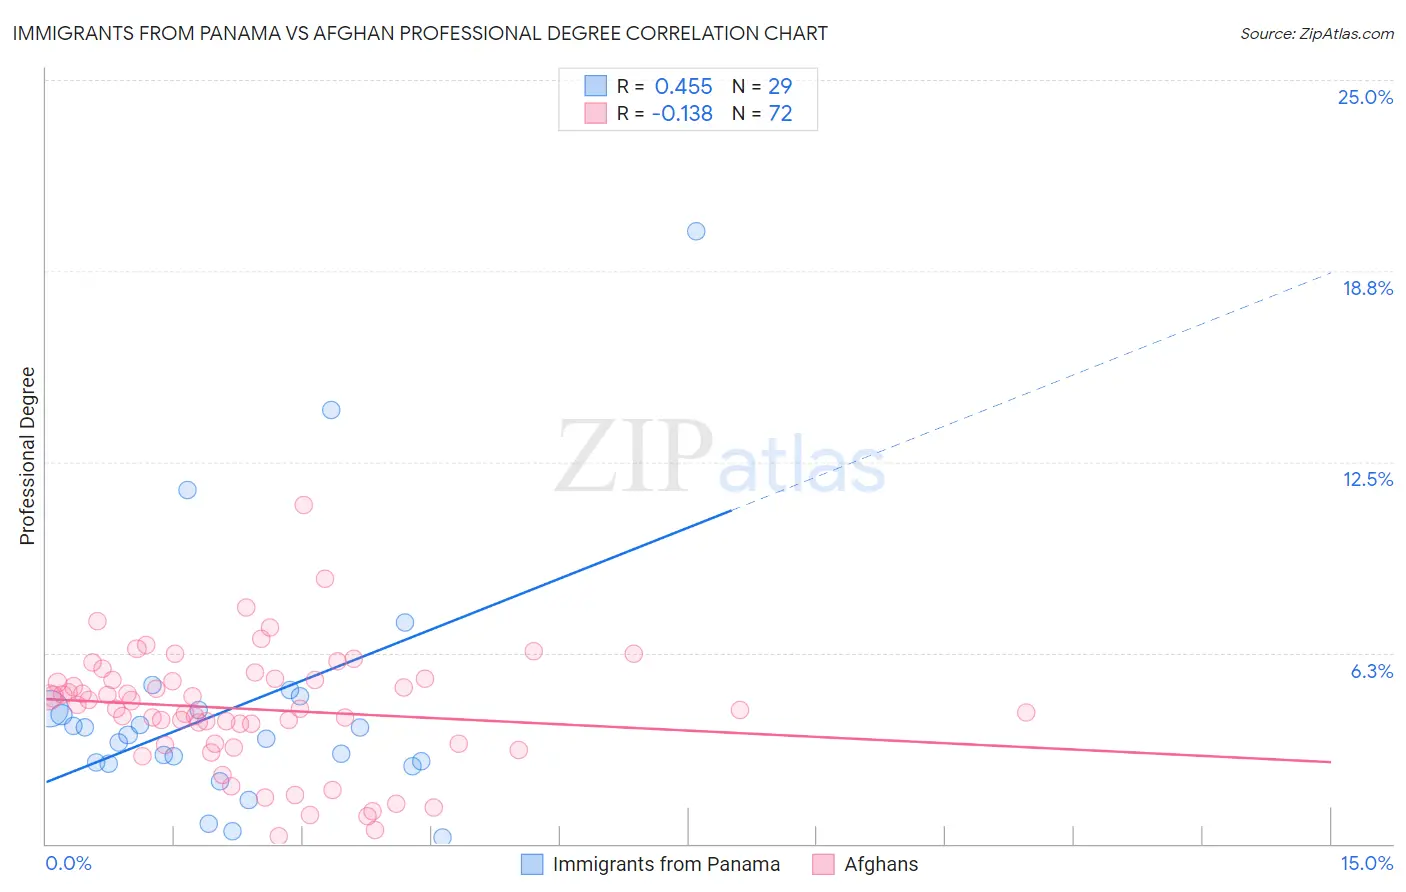
Immigrants from Panama vs Afghan Professional Degree Correlation Chart
The statistical analysis conducted on geographies consisting of 221,001,104 people shows a moderate positive correlation between the proportion of Immigrants from Panama and percentage of population with at least professional degree education in the United States with a correlation coefficient (R) of 0.455 and weighted average of 4.1%. Similarly, the statistical analysis conducted on geographies consisting of 148,828,949 people shows a poor negative correlation between the proportion of Afghans and percentage of population with at least professional degree education in the United States with a correlation coefficient (R) of -0.138 and weighted average of 4.7%, a difference of 15.8%.
Professional Degree Correlation Summary
| Measurement | Immigrants from Panama | Afghan |
| Minimum | 0.20% | 0.26% |
| Maximum | 20.0% | 11.1% |
| Range | 19.9% | 10.8% |
| Mean | 4.5% | 4.4% |
| Median | 3.6% | 4.5% |
| Interquartile 25% (IQ1) | 2.6% | 3.3% |
| Interquartile 75% (IQ3) | 4.6% | 5.4% |
| Interquartile Range (IQR) | 2.0% | 2.1% |
| Standard Deviation (Sample) | 4.2% | 1.9% |
| Standard Deviation (Population) | 4.1% | 1.9% |
Similar Demographics by Professional Degree
Demographics Similar to Immigrants from Panama by Professional Degree
In terms of professional degree, the demographic groups most similar to Immigrants from Panama are Immigrants from Somalia (4.1%, a difference of 0.080%), Subsaharan African (4.1%, a difference of 0.16%), Immigrants from Nigeria (4.1%, a difference of 0.22%), German (4.1%, a difference of 0.26%), and Yugoslavian (4.1%, a difference of 0.40%).
| Demographics | Rating | Rank | Professional Degree |
| Immigrants | Iraq | 17.1 /100 | #202 | Poor 4.2% |
| Panamanians | 15.9 /100 | #203 | Poor 4.1% |
| Barbadians | 15.8 /100 | #204 | Poor 4.1% |
| Somalis | 14.8 /100 | #205 | Poor 4.1% |
| Yugoslavians | 13.4 /100 | #206 | Poor 4.1% |
| Sub-Saharan Africans | 12.8 /100 | #207 | Poor 4.1% |
| Immigrants | Somalia | 12.5 /100 | #208 | Poor 4.1% |
| Immigrants | Panama | 12.3 /100 | #209 | Poor 4.1% |
| Immigrants | Nigeria | 11.7 /100 | #210 | Poor 4.1% |
| Germans | 11.6 /100 | #211 | Poor 4.1% |
| Whites/Caucasians | 11.2 /100 | #212 | Poor 4.1% |
| Koreans | 10.7 /100 | #213 | Poor 4.1% |
| Immigrants | Ghana | 10.6 /100 | #214 | Poor 4.1% |
| Portuguese | 10.5 /100 | #215 | Poor 4.1% |
| West Indians | 9.8 /100 | #216 | Tragic 4.1% |
Demographics Similar to Afghans by Professional Degree
In terms of professional degree, the demographic groups most similar to Afghans are Jordanian (4.7%, a difference of 0.040%), Immigrants from Jordan (4.7%, a difference of 0.060%), Macedonian (4.8%, a difference of 0.34%), South American Indian (4.8%, a difference of 0.38%), and Italian (4.8%, a difference of 0.50%).
| Demographics | Rating | Rank | Professional Degree |
| Immigrants | Nepal | 91.4 /100 | #131 | Exceptional 4.8% |
| Pakistanis | 90.9 /100 | #132 | Exceptional 4.8% |
| Italians | 90.2 /100 | #133 | Exceptional 4.8% |
| South American Indians | 89.9 /100 | #134 | Excellent 4.8% |
| Macedonians | 89.8 /100 | #135 | Excellent 4.8% |
| Immigrants | Jordan | 89.0 /100 | #136 | Excellent 4.7% |
| Jordanians | 88.9 /100 | #137 | Excellent 4.7% |
| Afghans | 88.8 /100 | #138 | Excellent 4.7% |
| South Americans | 85.6 /100 | #139 | Excellent 4.7% |
| Canadians | 84.4 /100 | #140 | Excellent 4.7% |
| Basques | 81.8 /100 | #141 | Excellent 4.6% |
| Sudanese | 81.3 /100 | #142 | Excellent 4.6% |
| Hungarians | 80.8 /100 | #143 | Excellent 4.6% |
| Immigrants | South America | 80.5 /100 | #144 | Excellent 4.6% |
| Uruguayans | 80.2 /100 | #145 | Excellent 4.6% |