Immigrants from Pakistan vs Immigrants from Bahamas Nursery School
COMPARE
Immigrants from Pakistan
Immigrants from Bahamas
Nursery School
Nursery School Comparison
Immigrants from Pakistan
Immigrants from Bahamas
97.7%
NURSERY SCHOOL
2.1/ 100
METRIC RATING
235th/ 347
METRIC RANK
97.8%
NURSERY SCHOOL
8.6/ 100
METRIC RATING
212th/ 347
METRIC RANK
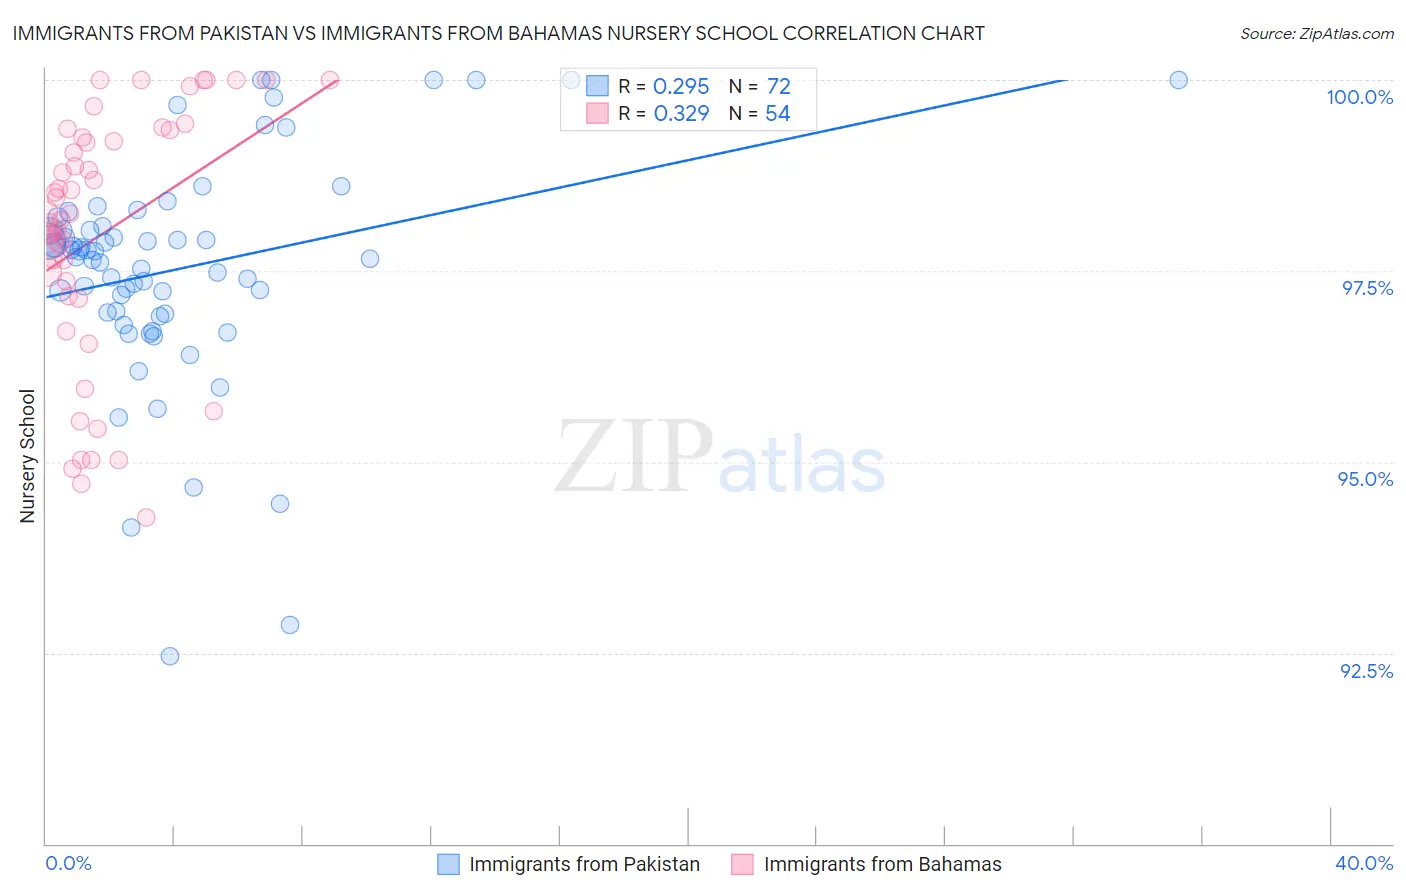
Immigrants from Pakistan vs Immigrants from Bahamas Nursery School Correlation Chart
The statistical analysis conducted on geographies consisting of 283,901,001 people shows a weak positive correlation between the proportion of Immigrants from Pakistan and percentage of population with at least nursery school education in the United States with a correlation coefficient (R) of 0.295 and weighted average of 97.7%. Similarly, the statistical analysis conducted on geographies consisting of 104,666,627 people shows a mild positive correlation between the proportion of Immigrants from Bahamas and percentage of population with at least nursery school education in the United States with a correlation coefficient (R) of 0.329 and weighted average of 97.8%, a difference of 0.11%.
Nursery School Correlation Summary
| Measurement | Immigrants from Pakistan | Immigrants from Bahamas |
| Minimum | 92.5% | 94.3% |
| Maximum | 100.0% | 100.0% |
| Range | 7.5% | 5.7% |
| Mean | 97.5% | 98.0% |
| Median | 97.7% | 98.2% |
| Interquartile 25% (IQ1) | 96.9% | 97.2% |
| Interquartile 75% (IQ3) | 98.1% | 99.2% |
| Interquartile Range (IQR) | 1.1% | 2.1% |
| Standard Deviation (Sample) | 1.5% | 1.6% |
| Standard Deviation (Population) | 1.5% | 1.6% |
Similar Demographics by Nursery School
Demographics Similar to Immigrants from Pakistan by Nursery School
In terms of nursery school, the demographic groups most similar to Immigrants from Pakistan are U.S. Virgin Islander (97.7%, a difference of 0.0%), Colombian (97.7%, a difference of 0.0%), Immigrants from Uruguay (97.7%, a difference of 0.010%), Immigrants from Malaysia (97.7%, a difference of 0.010%), and Immigrants from Western Asia (97.7%, a difference of 0.010%).
| Demographics | Rating | Rank | Nursery School |
| Sudanese | 3.2 /100 | #228 | Tragic 97.7% |
| Senegalese | 3.2 /100 | #229 | Tragic 97.7% |
| Sierra Leoneans | 2.9 /100 | #230 | Tragic 97.7% |
| Puerto Ricans | 2.6 /100 | #231 | Tragic 97.7% |
| Immigrants | Uruguay | 2.3 /100 | #232 | Tragic 97.7% |
| U.S. Virgin Islanders | 2.1 /100 | #233 | Tragic 97.7% |
| Colombians | 2.1 /100 | #234 | Tragic 97.7% |
| Immigrants | Pakistan | 2.1 /100 | #235 | Tragic 97.7% |
| Immigrants | Malaysia | 1.9 /100 | #236 | Tragic 97.7% |
| Immigrants | Western Asia | 1.9 /100 | #237 | Tragic 97.7% |
| Nigerians | 1.7 /100 | #238 | Tragic 97.7% |
| Immigrants | Eastern Asia | 1.6 /100 | #239 | Tragic 97.7% |
| Koreans | 1.4 /100 | #240 | Tragic 97.7% |
| Immigrants | Indonesia | 1.1 /100 | #241 | Tragic 97.7% |
| Liberians | 1.1 /100 | #242 | Tragic 97.7% |
Demographics Similar to Immigrants from Bahamas by Nursery School
In terms of nursery school, the demographic groups most similar to Immigrants from Bahamas are Moroccan (97.8%, a difference of 0.0%), Immigrants from Oceania (97.8%, a difference of 0.010%), Laotian (97.8%, a difference of 0.010%), South American Indian (97.8%, a difference of 0.010%), and Bahamian (97.8%, a difference of 0.010%).
| Demographics | Rating | Rank | Nursery School |
| Immigrants | Chile | 17.3 /100 | #205 | Poor 97.9% |
| Immigrants | Albania | 16.4 /100 | #206 | Poor 97.9% |
| Africans | 15.4 /100 | #207 | Poor 97.9% |
| Immigrants | Northern Africa | 11.7 /100 | #208 | Poor 97.8% |
| Costa Ricans | 11.3 /100 | #209 | Poor 97.8% |
| Immigrants | Oceania | 10.2 /100 | #210 | Poor 97.8% |
| Laotians | 9.8 /100 | #211 | Tragic 97.8% |
| Immigrants | Bahamas | 8.6 /100 | #212 | Tragic 97.8% |
| Moroccans | 8.3 /100 | #213 | Tragic 97.8% |
| South American Indians | 8.0 /100 | #214 | Tragic 97.8% |
| Bahamians | 7.4 /100 | #215 | Tragic 97.8% |
| Uruguayans | 7.1 /100 | #216 | Tragic 97.8% |
| Samoans | 6.3 /100 | #217 | Tragic 97.8% |
| Immigrants | Panama | 5.3 /100 | #218 | Tragic 97.8% |
| Immigrants | Morocco | 5.1 /100 | #219 | Tragic 97.8% |