Immigrants from Nigeria vs Iroquois 12th Grade, No Diploma
COMPARE
Immigrants from Nigeria
Iroquois
12th Grade, No Diploma
12th Grade, No Diploma Comparison
Immigrants from Nigeria
Iroquois
89.9%
12TH GRADE, NO DIPLOMA
1.3/ 100
METRIC RATING
247th/ 347
METRIC RANK
91.1%
12TH GRADE, NO DIPLOMA
48.5/ 100
METRIC RATING
176th/ 347
METRIC RANK
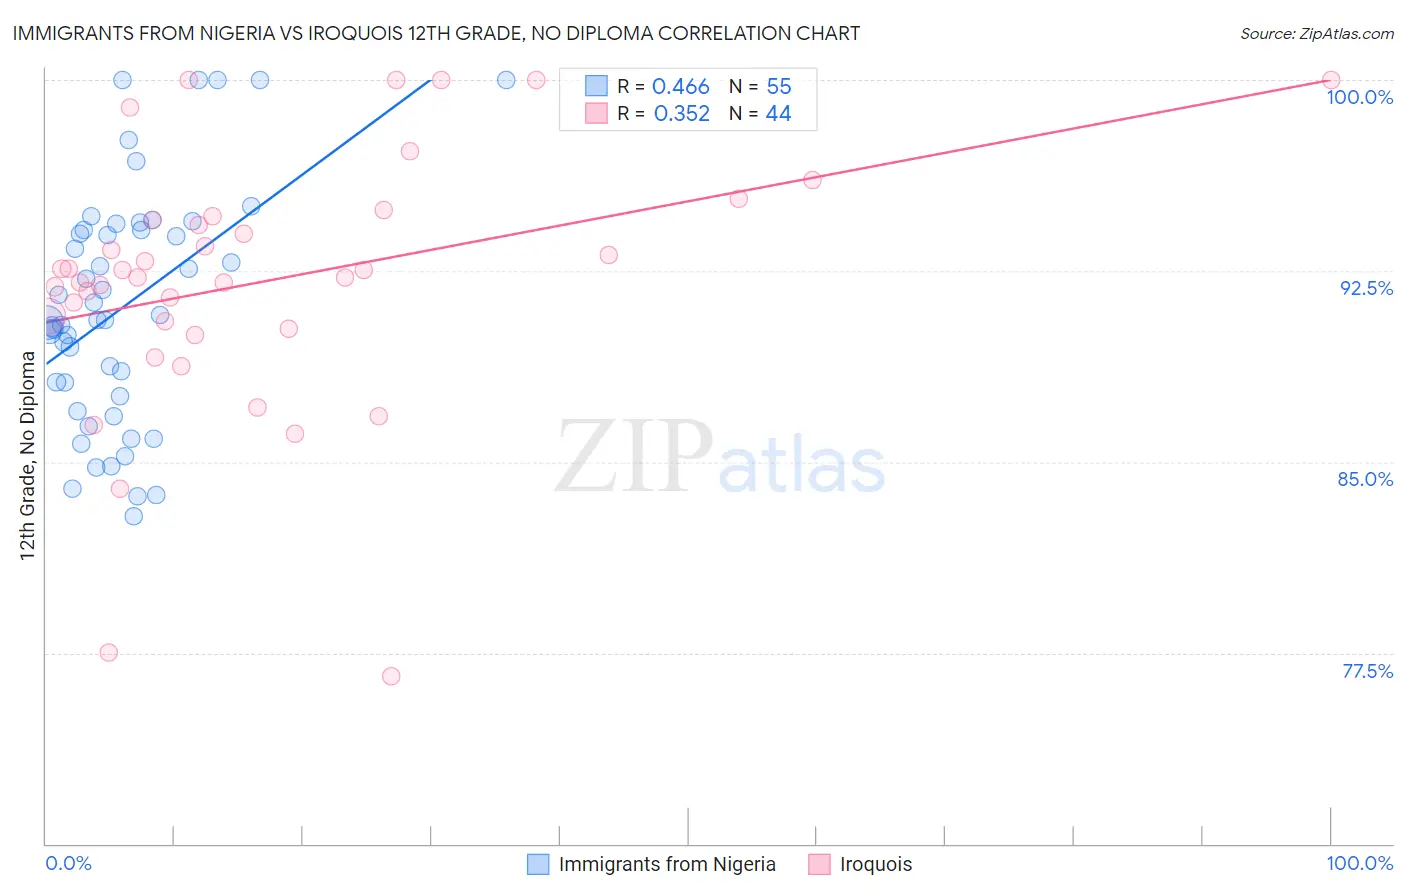
Immigrants from Nigeria vs Iroquois 12th Grade, No Diploma Correlation Chart
The statistical analysis conducted on geographies consisting of 283,441,873 people shows a moderate positive correlation between the proportion of Immigrants from Nigeria and percentage of population with at least 12th grade (no diploma) education in the United States with a correlation coefficient (R) of 0.466 and weighted average of 89.9%. Similarly, the statistical analysis conducted on geographies consisting of 207,308,653 people shows a mild positive correlation between the proportion of Iroquois and percentage of population with at least 12th grade (no diploma) education in the United States with a correlation coefficient (R) of 0.352 and weighted average of 91.1%, a difference of 1.3%.
12th Grade, No Diploma Correlation Summary
| Measurement | Immigrants from Nigeria | Iroquois |
| Minimum | 82.9% | 76.6% |
| Maximum | 100.0% | 100.0% |
| Range | 17.1% | 23.4% |
| Mean | 91.1% | 92.1% |
| Median | 90.6% | 92.4% |
| Interquartile 25% (IQ1) | 87.6% | 90.4% |
| Interquartile 75% (IQ3) | 94.1% | 94.6% |
| Interquartile Range (IQR) | 6.5% | 4.2% |
| Standard Deviation (Sample) | 4.6% | 5.1% |
| Standard Deviation (Population) | 4.5% | 5.0% |
Similar Demographics by 12th Grade, No Diploma
Demographics Similar to Immigrants from Nigeria by 12th Grade, No Diploma
In terms of 12th grade, no diploma, the demographic groups most similar to Immigrants from Nigeria are Ghanaian (90.0%, a difference of 0.010%), Immigrants from Uruguay (90.0%, a difference of 0.020%), Comanche (89.9%, a difference of 0.050%), Crow (90.0%, a difference of 0.060%), and Taiwanese (90.0%, a difference of 0.060%).
| Demographics | Rating | Rank | 12th Grade, No Diploma |
| Kiowa | 1.7 /100 | #240 | Tragic 90.0% |
| Immigrants | Middle Africa | 1.7 /100 | #241 | Tragic 90.0% |
| Immigrants | Costa Rica | 1.6 /100 | #242 | Tragic 90.0% |
| Crow | 1.5 /100 | #243 | Tragic 90.0% |
| Taiwanese | 1.5 /100 | #244 | Tragic 90.0% |
| Immigrants | Uruguay | 1.4 /100 | #245 | Tragic 90.0% |
| Ghanaians | 1.3 /100 | #246 | Tragic 90.0% |
| Immigrants | Nigeria | 1.3 /100 | #247 | Tragic 89.9% |
| Comanche | 1.1 /100 | #248 | Tragic 89.9% |
| Senegalese | 1.1 /100 | #249 | Tragic 89.9% |
| Immigrants | Eritrea | 1.0 /100 | #250 | Tragic 89.9% |
| Spanish Americans | 0.9 /100 | #251 | Tragic 89.9% |
| Bahamians | 0.9 /100 | #252 | Tragic 89.9% |
| Choctaw | 0.7 /100 | #253 | Tragic 89.8% |
| Immigrants | Peru | 0.5 /100 | #254 | Tragic 89.7% |
Demographics Similar to Iroquois by 12th Grade, No Diploma
In terms of 12th grade, no diploma, the demographic groups most similar to Iroquois are Immigrants from Western Asia (91.2%, a difference of 0.010%), Sierra Leonean (91.1%, a difference of 0.010%), Bolivian (91.2%, a difference of 0.020%), Immigrants from Nepal (91.2%, a difference of 0.020%), and Bermudan (91.2%, a difference of 0.030%).
| Demographics | Rating | Rank | 12th Grade, No Diploma |
| Immigrants | Indonesia | 54.9 /100 | #169 | Average 91.2% |
| Delaware | 52.8 /100 | #170 | Average 91.2% |
| Immigrants | Morocco | 51.4 /100 | #171 | Average 91.2% |
| Bermudans | 50.8 /100 | #172 | Average 91.2% |
| Bolivians | 50.4 /100 | #173 | Average 91.2% |
| Immigrants | Nepal | 50.0 /100 | #174 | Average 91.2% |
| Immigrants | Western Asia | 49.0 /100 | #175 | Average 91.2% |
| Iroquois | 48.5 /100 | #176 | Average 91.1% |
| Sierra Leoneans | 47.7 /100 | #177 | Average 91.1% |
| Spanish | 43.7 /100 | #178 | Average 91.1% |
| Immigrants | Chile | 43.3 /100 | #179 | Average 91.1% |
| Immigrants | Syria | 40.3 /100 | #180 | Average 91.1% |
| Guamanians/Chamorros | 39.5 /100 | #181 | Fair 91.0% |
| Immigrants | Nonimmigrants | 38.8 /100 | #182 | Fair 91.0% |
| Osage | 38.3 /100 | #183 | Fair 91.0% |