Immigrants from Pakistan vs Immigrants from Argentina 9th Grade
COMPARE
Immigrants from Pakistan
Immigrants from Argentina
9th Grade
9th Grade Comparison
Immigrants from Pakistan
Immigrants from Argentina
94.6%
9TH GRADE
15.5/ 100
METRIC RATING
208th/ 347
METRIC RANK
94.8%
9TH GRADE
34.4/ 100
METRIC RATING
189th/ 347
METRIC RANK
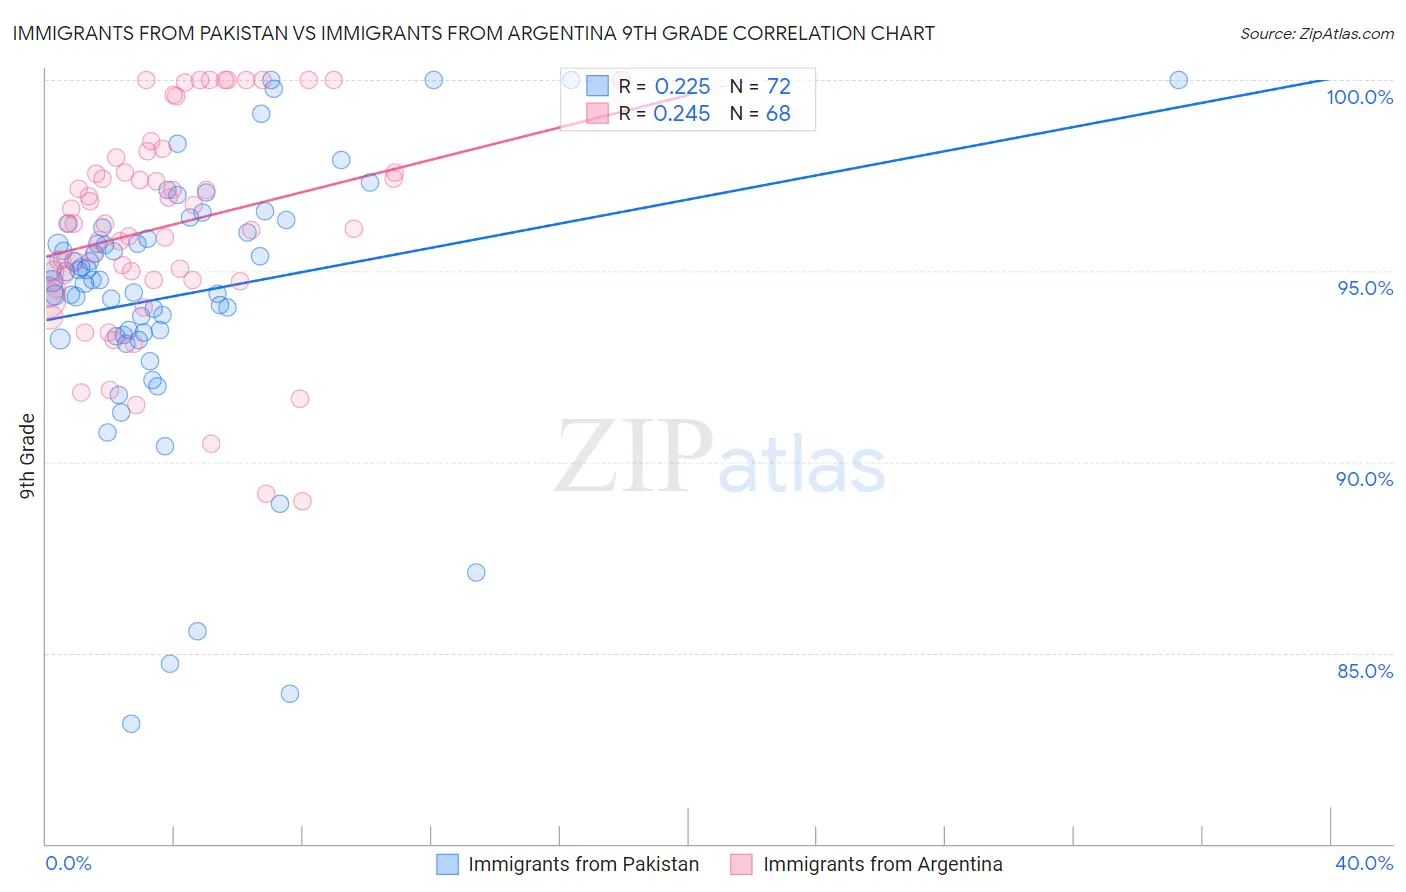
Immigrants from Pakistan vs Immigrants from Argentina 9th Grade Correlation Chart
The statistical analysis conducted on geographies consisting of 283,862,965 people shows a weak positive correlation between the proportion of Immigrants from Pakistan and percentage of population with at least 9th grade education in the United States with a correlation coefficient (R) of 0.225 and weighted average of 94.6%. Similarly, the statistical analysis conducted on geographies consisting of 264,436,618 people shows a weak positive correlation between the proportion of Immigrants from Argentina and percentage of population with at least 9th grade education in the United States with a correlation coefficient (R) of 0.245 and weighted average of 94.8%, a difference of 0.19%.
9th Grade Correlation Summary
| Measurement | Immigrants from Pakistan | Immigrants from Argentina |
| Minimum | 83.1% | 89.0% |
| Maximum | 100.0% | 100.0% |
| Range | 16.9% | 11.0% |
| Mean | 94.4% | 96.2% |
| Median | 94.8% | 96.2% |
| Interquartile 25% (IQ1) | 93.4% | 94.8% |
| Interquartile 75% (IQ3) | 96.1% | 97.8% |
| Interquartile Range (IQR) | 2.7% | 3.0% |
| Standard Deviation (Sample) | 3.4% | 2.7% |
| Standard Deviation (Population) | 3.4% | 2.7% |
Demographics Similar to Immigrants from Pakistan and Immigrants from Argentina by 9th Grade
In terms of 9th grade, the demographic groups most similar to Immigrants from Pakistan are Immigrants from Morocco (94.6%, a difference of 0.010%), Samoan (94.6%, a difference of 0.020%), Immigrants from Sudan (94.6%, a difference of 0.030%), Immigrants from Eastern Asia (94.6%, a difference of 0.050%), and Immigrants from Bahamas (94.6%, a difference of 0.050%). Similarly, the demographic groups most similar to Immigrants from Argentina are Immigrants from Albania (94.8%, a difference of 0.0%), Sudanese (94.7%, a difference of 0.010%), Assyrian/Chaldean/Syriac (94.7%, a difference of 0.020%), Immigrants from Northern Africa (94.7%, a difference of 0.030%), and Paraguayan (94.7%, a difference of 0.040%).
| Demographics | Rating | Rank | 9th Grade |
| Immigrants | Albania | 34.5 /100 | #188 | Fair 94.8% |
| Immigrants | Argentina | 34.4 /100 | #189 | Fair 94.8% |
| Sudanese | 32.7 /100 | #190 | Fair 94.7% |
| Assyrians/Chaldeans/Syriacs | 32.0 /100 | #191 | Fair 94.7% |
| Immigrants | Northern Africa | 30.7 /100 | #192 | Fair 94.7% |
| Paraguayans | 30.1 /100 | #193 | Fair 94.7% |
| Panamanians | 29.0 /100 | #194 | Fair 94.7% |
| Marshallese | 27.9 /100 | #195 | Fair 94.7% |
| Immigrants | Lebanon | 27.2 /100 | #196 | Fair 94.7% |
| Immigrants | Micronesia | 24.7 /100 | #197 | Fair 94.7% |
| Hawaiians | 22.7 /100 | #198 | Fair 94.7% |
| Laotians | 21.0 /100 | #199 | Fair 94.6% |
| Immigrants | Zaire | 20.6 /100 | #200 | Fair 94.6% |
| Blacks/African Americans | 20.5 /100 | #201 | Fair 94.6% |
| Immigrants | Eastern Asia | 19.8 /100 | #202 | Poor 94.6% |
| Immigrants | Bahamas | 19.8 /100 | #203 | Poor 94.6% |
| Moroccans | 19.6 /100 | #204 | Poor 94.6% |
| Immigrants | Sudan | 17.6 /100 | #205 | Poor 94.6% |
| Samoans | 17.3 /100 | #206 | Poor 94.6% |
| Immigrants | Morocco | 16.3 /100 | #207 | Poor 94.6% |
| Immigrants | Pakistan | 15.5 /100 | #208 | Poor 94.6% |