Immigrants from Pakistan vs Scotch-Irish 9th Grade
COMPARE
Immigrants from Pakistan
Scotch-Irish
9th Grade
9th Grade Comparison
Immigrants from Pakistan
Scotch-Irish
94.6%
9TH GRADE
15.5/ 100
METRIC RATING
208th/ 347
METRIC RANK
96.3%
9TH GRADE
100.0/ 100
METRIC RATING
27th/ 347
METRIC RANK
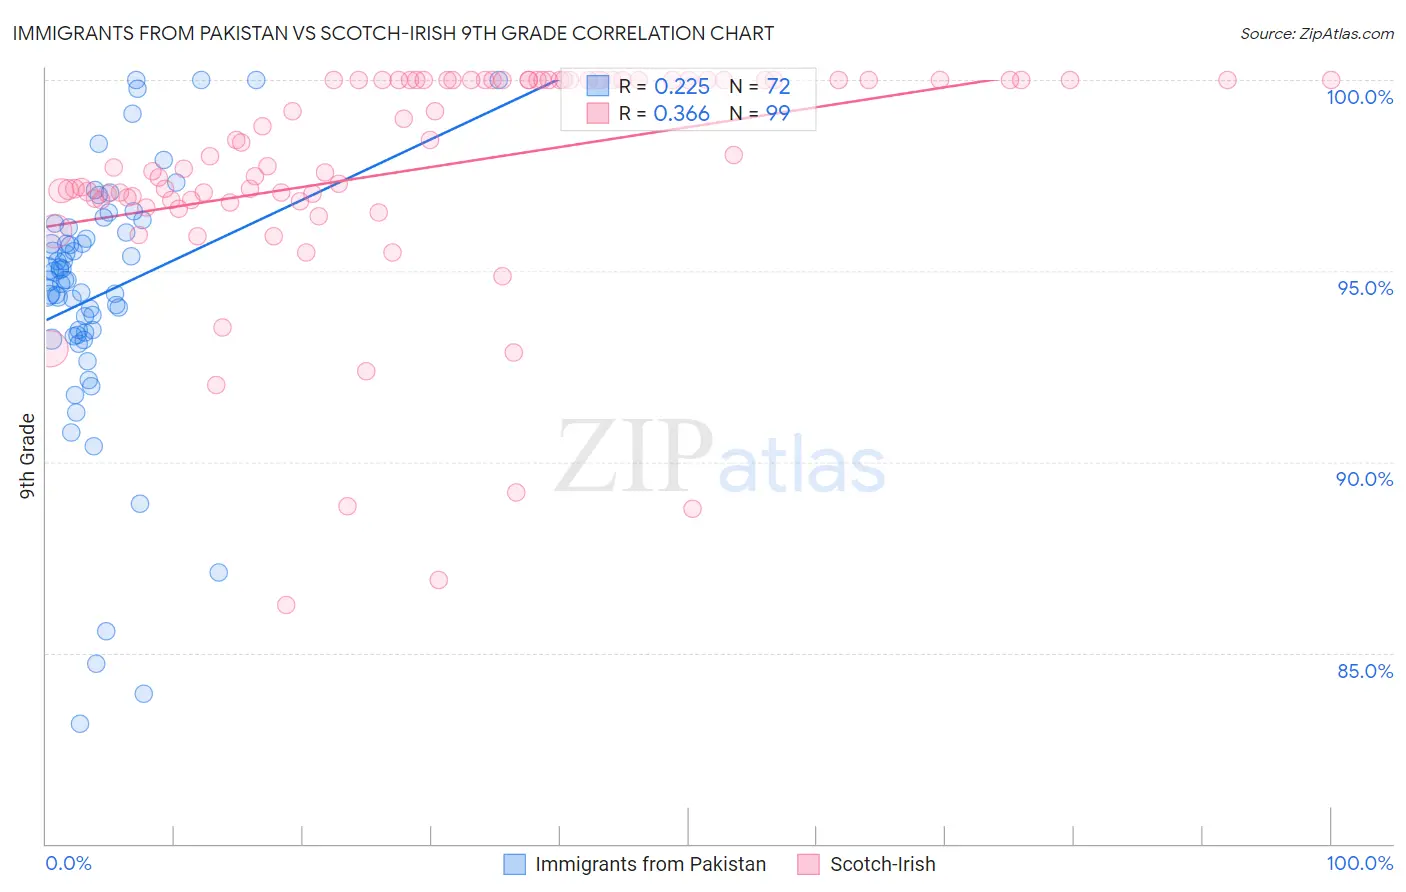
Immigrants from Pakistan vs Scotch-Irish 9th Grade Correlation Chart
The statistical analysis conducted on geographies consisting of 283,862,965 people shows a weak positive correlation between the proportion of Immigrants from Pakistan and percentage of population with at least 9th grade education in the United States with a correlation coefficient (R) of 0.225 and weighted average of 94.6%. Similarly, the statistical analysis conducted on geographies consisting of 548,780,564 people shows a mild positive correlation between the proportion of Scotch-Irish and percentage of population with at least 9th grade education in the United States with a correlation coefficient (R) of 0.366 and weighted average of 96.3%, a difference of 1.8%.
9th Grade Correlation Summary
| Measurement | Immigrants from Pakistan | Scotch-Irish |
| Minimum | 83.1% | 86.2% |
| Maximum | 100.0% | 100.0% |
| Range | 16.9% | 13.8% |
| Mean | 94.4% | 97.7% |
| Median | 94.8% | 98.0% |
| Interquartile 25% (IQ1) | 93.4% | 96.9% |
| Interquartile 75% (IQ3) | 96.1% | 100.0% |
| Interquartile Range (IQR) | 2.7% | 3.1% |
| Standard Deviation (Sample) | 3.4% | 3.0% |
| Standard Deviation (Population) | 3.4% | 3.0% |
Similar Demographics by 9th Grade
Demographics Similar to Immigrants from Pakistan by 9th Grade
In terms of 9th grade, the demographic groups most similar to Immigrants from Pakistan are Immigrants from Morocco (94.6%, a difference of 0.010%), Comanche (94.6%, a difference of 0.010%), Samoan (94.6%, a difference of 0.020%), Immigrants from Sudan (94.6%, a difference of 0.030%), and Immigrants from Chile (94.5%, a difference of 0.030%).
| Demographics | Rating | Rank | 9th Grade |
| Blacks/African Americans | 20.5 /100 | #201 | Fair 94.6% |
| Immigrants | Eastern Asia | 19.8 /100 | #202 | Poor 94.6% |
| Immigrants | Bahamas | 19.8 /100 | #203 | Poor 94.6% |
| Moroccans | 19.6 /100 | #204 | Poor 94.6% |
| Immigrants | Sudan | 17.6 /100 | #205 | Poor 94.6% |
| Samoans | 17.3 /100 | #206 | Poor 94.6% |
| Immigrants | Morocco | 16.3 /100 | #207 | Poor 94.6% |
| Immigrants | Pakistan | 15.5 /100 | #208 | Poor 94.6% |
| Comanche | 14.9 /100 | #209 | Poor 94.6% |
| Immigrants | Chile | 13.4 /100 | #210 | Poor 94.5% |
| Immigrants | Indonesia | 12.3 /100 | #211 | Poor 94.5% |
| Immigrants | Malaysia | 12.2 /100 | #212 | Poor 94.5% |
| Immigrants | Oceania | 12.1 /100 | #213 | Poor 94.5% |
| Immigrants | Liberia | 11.8 /100 | #214 | Poor 94.5% |
| Immigrants | Syria | 11.0 /100 | #215 | Poor 94.5% |
Demographics Similar to Scotch-Irish by 9th Grade
In terms of 9th grade, the demographic groups most similar to Scotch-Irish are Eastern European (96.3%, a difference of 0.0%), Chinese (96.3%, a difference of 0.0%), French Canadian (96.3%, a difference of 0.010%), Maltese (96.3%, a difference of 0.030%), and British (96.3%, a difference of 0.030%).
| Demographics | Rating | Rank | 9th Grade |
| Italians | 100.0 /100 | #20 | Exceptional 96.4% |
| Alaskan Athabascans | 100.0 /100 | #21 | Exceptional 96.4% |
| Europeans | 100.0 /100 | #22 | Exceptional 96.4% |
| Czechs | 100.0 /100 | #23 | Exceptional 96.4% |
| Latvians | 100.0 /100 | #24 | Exceptional 96.4% |
| French | 100.0 /100 | #25 | Exceptional 96.3% |
| French Canadians | 100.0 /100 | #26 | Exceptional 96.3% |
| Scotch-Irish | 100.0 /100 | #27 | Exceptional 96.3% |
| Eastern Europeans | 100.0 /100 | #28 | Exceptional 96.3% |
| Chinese | 100.0 /100 | #29 | Exceptional 96.3% |
| Maltese | 100.0 /100 | #30 | Exceptional 96.3% |
| British | 100.0 /100 | #31 | Exceptional 96.3% |
| Belgians | 100.0 /100 | #32 | Exceptional 96.3% |
| Luxembourgers | 100.0 /100 | #33 | Exceptional 96.3% |
| Hungarians | 100.0 /100 | #34 | Exceptional 96.2% |