Immigrants from Oceania vs Immigrants from Cabo Verde Kindergarten
COMPARE
Immigrants from Oceania
Immigrants from Cabo Verde
Kindergarten
Kindergarten Comparison
Immigrants from Oceania
Immigrants from Cabo Verde
97.8%
KINDERGARTEN
11.1/ 100
METRIC RATING
210th/ 347
METRIC RANK
96.4%
KINDERGARTEN
0.0/ 100
METRIC RATING
341st/ 347
METRIC RANK
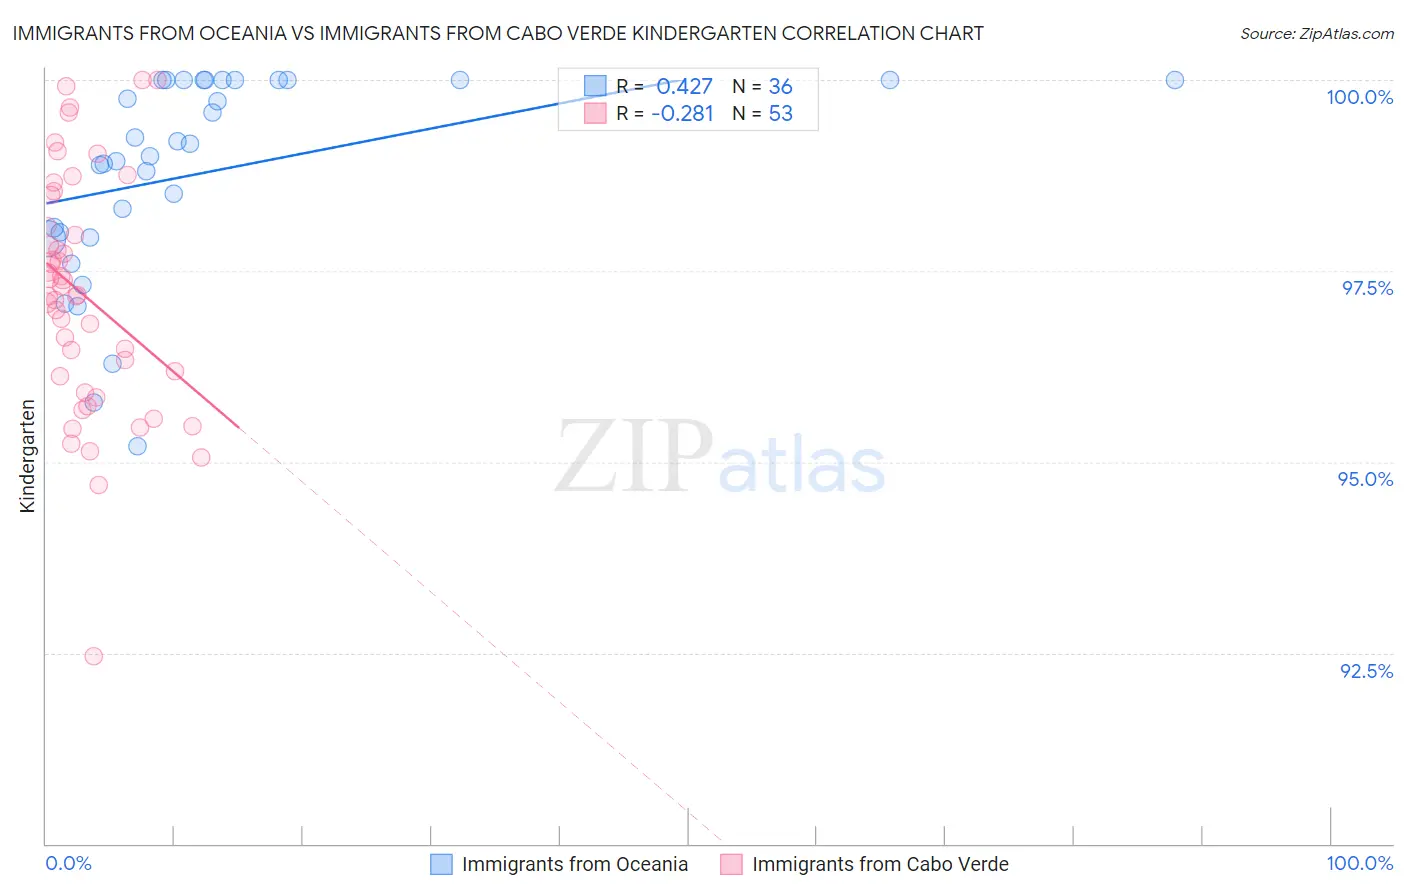
Immigrants from Oceania vs Immigrants from Cabo Verde Kindergarten Correlation Chart
The statistical analysis conducted on geographies consisting of 305,516,300 people shows a moderate positive correlation between the proportion of Immigrants from Oceania and percentage of population with at least kindergarten education in the United States with a correlation coefficient (R) of 0.427 and weighted average of 97.8%. Similarly, the statistical analysis conducted on geographies consisting of 38,158,666 people shows a weak negative correlation between the proportion of Immigrants from Cabo Verde and percentage of population with at least kindergarten education in the United States with a correlation coefficient (R) of -0.281 and weighted average of 96.4%, a difference of 1.5%.
Kindergarten Correlation Summary
| Measurement | Immigrants from Oceania | Immigrants from Cabo Verde |
| Minimum | 95.2% | 92.5% |
| Maximum | 100.0% | 100.0% |
| Range | 4.8% | 7.5% |
| Mean | 98.8% | 97.2% |
| Median | 99.1% | 97.2% |
| Interquartile 25% (IQ1) | 98.0% | 96.0% |
| Interquartile 75% (IQ3) | 100.0% | 98.3% |
| Interquartile Range (IQR) | 2.0% | 2.3% |
| Standard Deviation (Sample) | 1.3% | 1.5% |
| Standard Deviation (Population) | 1.3% | 1.5% |
Similar Demographics by Kindergarten
Demographics Similar to Immigrants from Oceania by Kindergarten
In terms of kindergarten, the demographic groups most similar to Immigrants from Oceania are Costa Rican (97.8%, a difference of 0.0%), Laotian (97.8%, a difference of 0.0%), Immigrants from Northern Africa (97.8%, a difference of 0.010%), Moroccan (97.8%, a difference of 0.020%), and Immigrants from Albania (97.8%, a difference of 0.030%).
| Demographics | Rating | Rank | Kindergarten |
| Immigrants | Uganda | 18.8 /100 | #203 | Poor 97.8% |
| Immigrants | Chile | 18.1 /100 | #204 | Poor 97.8% |
| Immigrants | Southern Europe | 18.0 /100 | #205 | Poor 97.8% |
| Immigrants | Albania | 16.4 /100 | #206 | Poor 97.8% |
| Africans | 16.1 /100 | #207 | Poor 97.8% |
| Immigrants | Northern Africa | 12.0 /100 | #208 | Poor 97.8% |
| Costa Ricans | 11.6 /100 | #209 | Poor 97.8% |
| Immigrants | Oceania | 11.1 /100 | #210 | Poor 97.8% |
| Laotians | 10.5 /100 | #211 | Poor 97.8% |
| Moroccans | 8.9 /100 | #212 | Tragic 97.8% |
| South American Indians | 7.7 /100 | #213 | Tragic 97.8% |
| Uruguayans | 7.5 /100 | #214 | Tragic 97.8% |
| Immigrants | Bahamas | 7.4 /100 | #215 | Tragic 97.8% |
| Samoans | 6.9 /100 | #216 | Tragic 97.8% |
| Bahamians | 6.6 /100 | #217 | Tragic 97.8% |
Demographics Similar to Immigrants from Cabo Verde by Kindergarten
In terms of kindergarten, the demographic groups most similar to Immigrants from Cabo Verde are Immigrants from Central America (96.4%, a difference of 0.0%), Immigrants from Mexico (96.4%, a difference of 0.020%), Immigrants from Guatemala (96.4%, a difference of 0.040%), Salvadoran (96.3%, a difference of 0.060%), and Immigrants from Cambodia (96.5%, a difference of 0.12%).
| Demographics | Rating | Rank | Kindergarten |
| Central Americans | 0.0 /100 | #333 | Tragic 96.6% |
| Immigrants | Dominican Republic | 0.0 /100 | #334 | Tragic 96.6% |
| Bangladeshis | 0.0 /100 | #335 | Tragic 96.6% |
| Guatemalans | 0.0 /100 | #336 | Tragic 96.5% |
| Immigrants | Cambodia | 0.0 /100 | #337 | Tragic 96.5% |
| Immigrants | Fiji | 0.0 /100 | #338 | Tragic 96.5% |
| Immigrants | Guatemala | 0.0 /100 | #339 | Tragic 96.4% |
| Immigrants | Central America | 0.0 /100 | #340 | Tragic 96.4% |
| Immigrants | Cabo Verde | 0.0 /100 | #341 | Tragic 96.4% |
| Immigrants | Mexico | 0.0 /100 | #342 | Tragic 96.4% |
| Salvadorans | 0.0 /100 | #343 | Tragic 96.3% |
| Nepalese | 0.0 /100 | #344 | Tragic 96.2% |
| Immigrants | El Salvador | 0.0 /100 | #345 | Tragic 96.2% |
| Immigrants | Yemen | 0.0 /100 | #346 | Tragic 95.9% |
| Spanish American Indians | 0.0 /100 | #347 | Tragic 95.8% |