Immigrants from Oceania vs Immigrants from Canada 8th Grade
COMPARE
Immigrants from Oceania
Immigrants from Canada
8th Grade
8th Grade Comparison
Immigrants from Oceania
Immigrants from Canada
95.3%
8TH GRADE
7.1/ 100
METRIC RATING
223rd/ 347
METRIC RANK
96.7%
8TH GRADE
99.8/ 100
METRIC RATING
58th/ 347
METRIC RANK
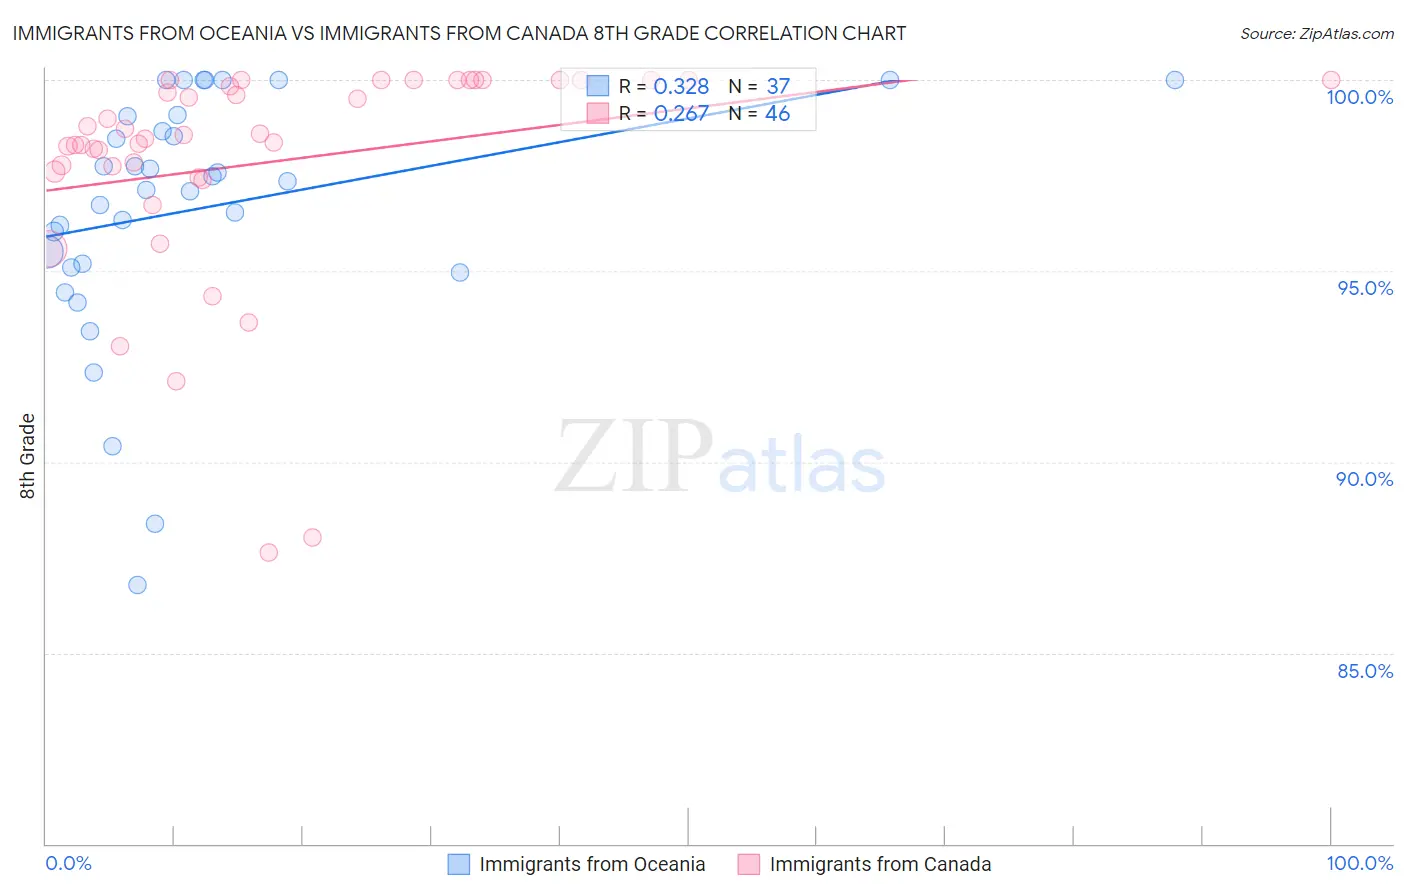
Immigrants from Oceania vs Immigrants from Canada 8th Grade Correlation Chart
The statistical analysis conducted on geographies consisting of 305,521,521 people shows a mild positive correlation between the proportion of Immigrants from Oceania and percentage of population with at least 8th grade education in the United States with a correlation coefficient (R) of 0.328 and weighted average of 95.3%. Similarly, the statistical analysis conducted on geographies consisting of 459,397,484 people shows a weak positive correlation between the proportion of Immigrants from Canada and percentage of population with at least 8th grade education in the United States with a correlation coefficient (R) of 0.267 and weighted average of 96.7%, a difference of 1.4%.
8th Grade Correlation Summary
| Measurement | Immigrants from Oceania | Immigrants from Canada |
| Minimum | 86.8% | 87.6% |
| Maximum | 100.0% | 100.0% |
| Range | 13.2% | 12.4% |
| Mean | 96.6% | 97.8% |
| Median | 97.3% | 98.5% |
| Interquartile 25% (IQ1) | 95.1% | 97.6% |
| Interquartile 75% (IQ3) | 99.1% | 100.0% |
| Interquartile Range (IQR) | 3.9% | 2.4% |
| Standard Deviation (Sample) | 3.2% | 2.9% |
| Standard Deviation (Population) | 3.2% | 2.9% |
Similar Demographics by 8th Grade
Demographics Similar to Immigrants from Oceania by 8th Grade
In terms of 8th grade, the demographic groups most similar to Immigrants from Oceania are Immigrants from Malaysia (95.3%, a difference of 0.0%), Immigrants from Southern Europe (95.3%, a difference of 0.010%), Immigrants from Syria (95.3%, a difference of 0.010%), Dutch West Indian (95.4%, a difference of 0.020%), and Spanish American (95.4%, a difference of 0.020%).
| Demographics | Rating | Rank | 8th Grade |
| Samoans | 8.4 /100 | #216 | Tragic 95.4% |
| Immigrants | Eastern Asia | 8.3 /100 | #217 | Tragic 95.4% |
| Dutch West Indians | 8.1 /100 | #218 | Tragic 95.4% |
| Spanish Americans | 8.0 /100 | #219 | Tragic 95.4% |
| Immigrants | Southern Europe | 7.7 /100 | #220 | Tragic 95.3% |
| Immigrants | Syria | 7.4 /100 | #221 | Tragic 95.3% |
| Immigrants | Malaysia | 7.3 /100 | #222 | Tragic 95.3% |
| Immigrants | Oceania | 7.1 /100 | #223 | Tragic 95.3% |
| Immigrants | Western Asia | 6.0 /100 | #224 | Tragic 95.3% |
| Sub-Saharan Africans | 6.0 /100 | #225 | Tragic 95.3% |
| Navajo | 5.7 /100 | #226 | Tragic 95.3% |
| Bahamians | 5.6 /100 | #227 | Tragic 95.3% |
| Immigrants | Eastern Africa | 5.6 /100 | #228 | Tragic 95.3% |
| Immigrants | Indonesia | 4.4 /100 | #229 | Tragic 95.3% |
| Immigrants | Panama | 4.1 /100 | #230 | Tragic 95.2% |
Demographics Similar to Immigrants from Canada by 8th Grade
In terms of 8th grade, the demographic groups most similar to Immigrants from Canada are Immigrants from North America (96.7%, a difference of 0.010%), Immigrants from Northern Europe (96.7%, a difference of 0.020%), Immigrants from Austria (96.7%, a difference of 0.020%), White/Caucasian (96.7%, a difference of 0.030%), and Russian (96.7%, a difference of 0.040%).
| Demographics | Rating | Rank | 8th Grade |
| Celtics | 99.9 /100 | #51 | Exceptional 96.8% |
| Greeks | 99.9 /100 | #52 | Exceptional 96.8% |
| Austrians | 99.9 /100 | #53 | Exceptional 96.7% |
| Serbians | 99.8 /100 | #54 | Exceptional 96.7% |
| Russians | 99.8 /100 | #55 | Exceptional 96.7% |
| Australians | 99.8 /100 | #56 | Exceptional 96.7% |
| Macedonians | 99.8 /100 | #57 | Exceptional 96.7% |
| Immigrants | Canada | 99.8 /100 | #58 | Exceptional 96.7% |
| Immigrants | North America | 99.8 /100 | #59 | Exceptional 96.7% |
| Immigrants | Northern Europe | 99.8 /100 | #60 | Exceptional 96.7% |
| Immigrants | Austria | 99.8 /100 | #61 | Exceptional 96.7% |
| Whites/Caucasians | 99.8 /100 | #62 | Exceptional 96.7% |
| Ukrainians | 99.7 /100 | #63 | Exceptional 96.7% |
| Immigrants | India | 99.7 /100 | #64 | Exceptional 96.6% |
| Native Hawaiians | 99.7 /100 | #65 | Exceptional 96.6% |