Ukrainian vs South African 9th Grade
COMPARE
Ukrainian
South African
9th Grade
9th Grade Comparison
Ukrainians
South Africans
95.9%
9TH GRADE
99.7/ 100
METRIC RATING
62nd/ 347
METRIC RANK
95.6%
9TH GRADE
98.8/ 100
METRIC RATING
90th/ 347
METRIC RANK
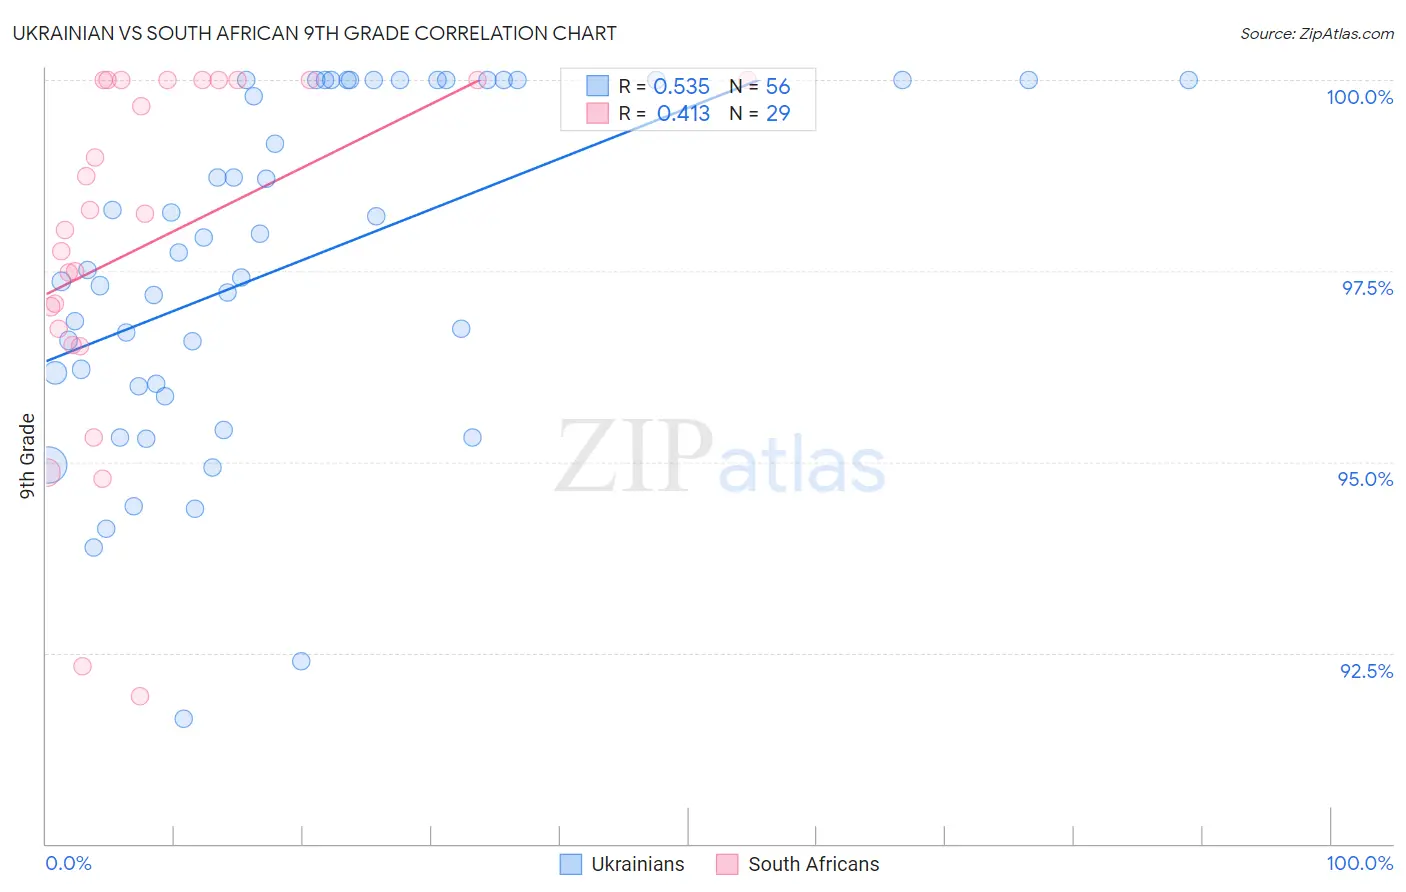
Ukrainian vs South African 9th Grade Correlation Chart
The statistical analysis conducted on geographies consisting of 448,696,826 people shows a substantial positive correlation between the proportion of Ukrainians and percentage of population with at least 9th grade education in the United States with a correlation coefficient (R) of 0.535 and weighted average of 95.9%. Similarly, the statistical analysis conducted on geographies consisting of 182,604,532 people shows a moderate positive correlation between the proportion of South Africans and percentage of population with at least 9th grade education in the United States with a correlation coefficient (R) of 0.413 and weighted average of 95.6%, a difference of 0.28%.
9th Grade Correlation Summary
| Measurement | Ukrainian | South African |
| Minimum | 91.6% | 91.9% |
| Maximum | 100.0% | 100.0% |
| Range | 8.4% | 8.1% |
| Mean | 97.6% | 97.9% |
| Median | 97.6% | 98.2% |
| Interquartile 25% (IQ1) | 96.0% | 96.6% |
| Interquartile 75% (IQ3) | 100.0% | 100.0% |
| Interquartile Range (IQR) | 4.0% | 3.4% |
| Standard Deviation (Sample) | 2.2% | 2.3% |
| Standard Deviation (Population) | 2.2% | 2.3% |
Similar Demographics by 9th Grade
Demographics Similar to Ukrainians by 9th Grade
In terms of 9th grade, the demographic groups most similar to Ukrainians are Sioux (95.9%, a difference of 0.010%), Native Hawaiian (95.9%, a difference of 0.020%), New Zealander (95.9%, a difference of 0.040%), Canadian (95.9%, a difference of 0.040%), and Macedonian (96.0%, a difference of 0.050%).
| Demographics | Rating | Rank | 9th Grade |
| Immigrants | Austria | 99.8 /100 | #55 | Exceptional 96.0% |
| Immigrants | North America | 99.8 /100 | #56 | Exceptional 96.0% |
| Macedonians | 99.8 /100 | #57 | Exceptional 96.0% |
| Aleuts | 99.8 /100 | #58 | Exceptional 96.0% |
| New Zealanders | 99.8 /100 | #59 | Exceptional 95.9% |
| Native Hawaiians | 99.8 /100 | #60 | Exceptional 95.9% |
| Sioux | 99.8 /100 | #61 | Exceptional 95.9% |
| Ukrainians | 99.7 /100 | #62 | Exceptional 95.9% |
| Canadians | 99.7 /100 | #63 | Exceptional 95.9% |
| Zimbabweans | 99.7 /100 | #64 | Exceptional 95.9% |
| Immigrants | England | 99.6 /100 | #65 | Exceptional 95.9% |
| Immigrants | Netherlands | 99.6 /100 | #66 | Exceptional 95.8% |
| Cypriots | 99.6 /100 | #67 | Exceptional 95.8% |
| Immigrants | Ireland | 99.6 /100 | #68 | Exceptional 95.8% |
| Immigrants | Lithuania | 99.6 /100 | #69 | Exceptional 95.8% |
Demographics Similar to South Africans by 9th Grade
In terms of 9th grade, the demographic groups most similar to South Africans are Immigrants from Czechoslovakia (95.7%, a difference of 0.010%), Yugoslavian (95.7%, a difference of 0.010%), Creek (95.6%, a difference of 0.010%), Immigrants from Saudi Arabia (95.6%, a difference of 0.010%), and Okinawan (95.7%, a difference of 0.020%).
| Demographics | Rating | Rank | 9th Grade |
| Swiss | 99.2 /100 | #83 | Exceptional 95.7% |
| Immigrants | Denmark | 99.1 /100 | #84 | Exceptional 95.7% |
| Icelanders | 99.1 /100 | #85 | Exceptional 95.7% |
| Immigrants | Western Europe | 99.1 /100 | #86 | Exceptional 95.7% |
| Okinawans | 99.0 /100 | #87 | Exceptional 95.7% |
| Immigrants | Czechoslovakia | 98.9 /100 | #88 | Exceptional 95.7% |
| Yugoslavians | 98.9 /100 | #89 | Exceptional 95.7% |
| South Africans | 98.8 /100 | #90 | Exceptional 95.6% |
| Creek | 98.8 /100 | #91 | Exceptional 95.6% |
| Immigrants | Saudi Arabia | 98.8 /100 | #92 | Exceptional 95.6% |
| Immigrants | Germany | 98.7 /100 | #93 | Exceptional 95.6% |
| Immigrants | Latvia | 98.7 /100 | #94 | Exceptional 95.6% |
| Americans | 98.5 /100 | #95 | Exceptional 95.6% |
| Filipinos | 98.5 /100 | #96 | Exceptional 95.6% |
| Delaware | 98.4 /100 | #97 | Exceptional 95.6% |