Immigrants from Norway vs Portuguese No Schooling Completed
COMPARE
Immigrants from Norway
Portuguese
No Schooling Completed
No Schooling Completed Comparison
Immigrants from Norway
Portuguese
1.9%
NO SCHOOLING COMPLETED
96.1/ 100
METRIC RATING
114th/ 347
METRIC RANK
2.1%
NO SCHOOLING COMPLETED
43.9/ 100
METRIC RATING
180th/ 347
METRIC RANK
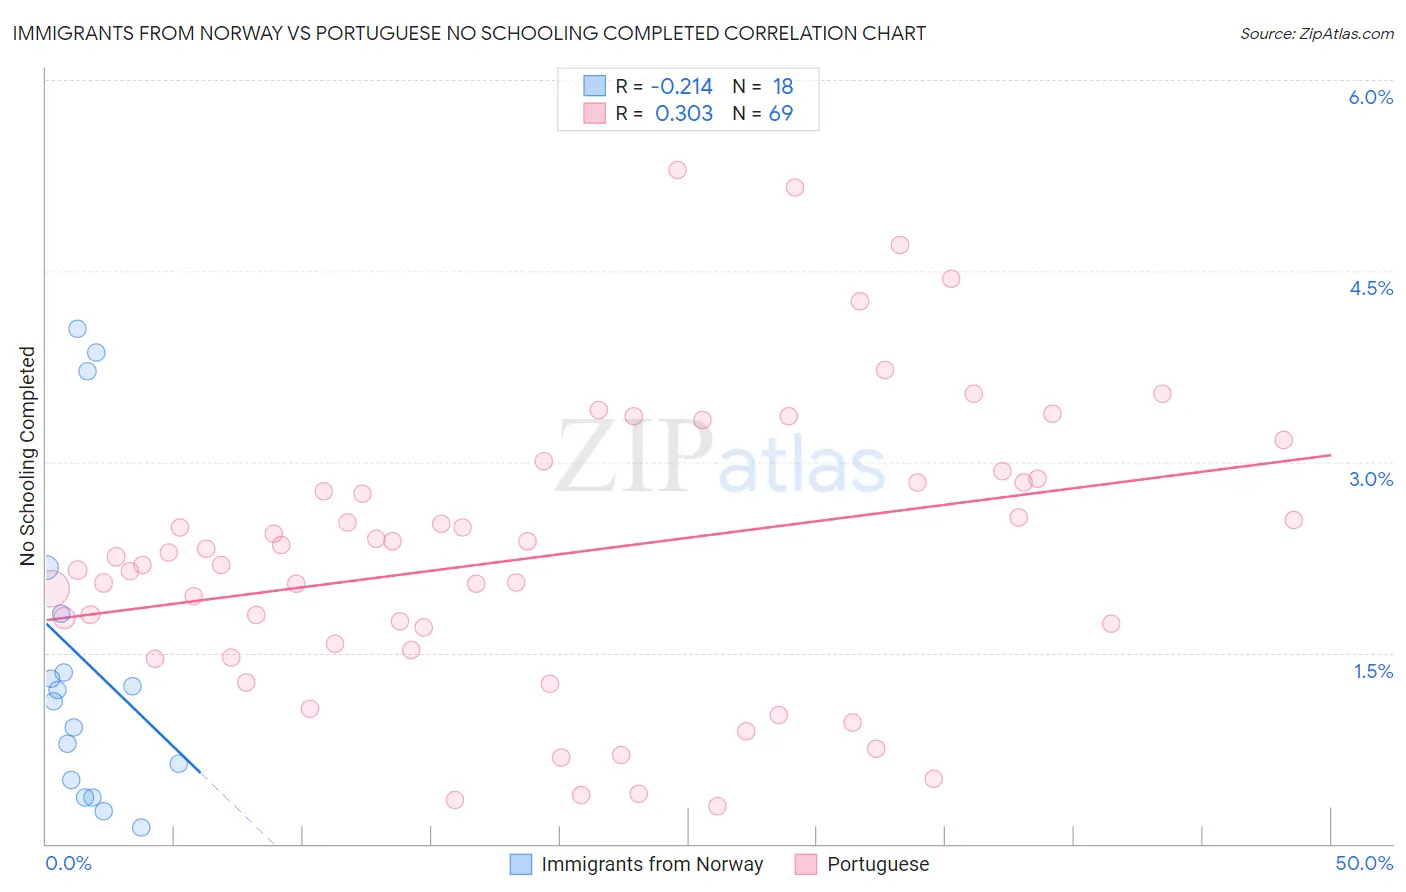
Immigrants from Norway vs Portuguese No Schooling Completed Correlation Chart
The statistical analysis conducted on geographies consisting of 116,062,009 people shows a weak negative correlation between the proportion of Immigrants from Norway and percentage of population with no schooling in the United States with a correlation coefficient (R) of -0.214 and weighted average of 1.9%. Similarly, the statistical analysis conducted on geographies consisting of 443,195,233 people shows a mild positive correlation between the proportion of Portuguese and percentage of population with no schooling in the United States with a correlation coefficient (R) of 0.303 and weighted average of 2.1%, a difference of 13.0%.
No Schooling Completed Correlation Summary
| Measurement | Immigrants from Norway | Portuguese |
| Minimum | 0.13% | 0.30% |
| Maximum | 4.0% | 5.3% |
| Range | 3.9% | 5.0% |
| Mean | 1.4% | 2.3% |
| Median | 1.2% | 2.3% |
| Interquartile 25% (IQ1) | 0.50% | 1.5% |
| Interquartile 75% (IQ3) | 1.8% | 2.9% |
| Interquartile Range (IQR) | 1.3% | 1.3% |
| Standard Deviation (Sample) | 1.2% | 1.1% |
| Standard Deviation (Population) | 1.2% | 1.1% |
Similar Demographics by No Schooling Completed
Demographics Similar to Immigrants from Norway by No Schooling Completed
In terms of no schooling completed, the demographic groups most similar to Immigrants from Norway are Immigrants from Zimbabwe (1.9%, a difference of 0.010%), Syrian (1.9%, a difference of 0.13%), Lebanese (1.9%, a difference of 0.15%), Pueblo (1.9%, a difference of 0.25%), and Immigrants from Serbia (1.9%, a difference of 0.35%).
| Demographics | Rating | Rank | No Schooling Completed |
| Yugoslavians | 97.2 /100 | #107 | Exceptional 1.8% |
| Okinawans | 97.1 /100 | #108 | Exceptional 1.8% |
| Immigrants | Saudi Arabia | 96.8 /100 | #109 | Exceptional 1.9% |
| Immigrants | Latvia | 96.7 /100 | #110 | Exceptional 1.9% |
| Immigrants | Japan | 96.6 /100 | #111 | Exceptional 1.9% |
| Pueblo | 96.4 /100 | #112 | Exceptional 1.9% |
| Immigrants | Zimbabwe | 96.2 /100 | #113 | Exceptional 1.9% |
| Immigrants | Norway | 96.1 /100 | #114 | Exceptional 1.9% |
| Syrians | 96.0 /100 | #115 | Exceptional 1.9% |
| Lebanese | 96.0 /100 | #116 | Exceptional 1.9% |
| Immigrants | Serbia | 95.8 /100 | #117 | Exceptional 1.9% |
| Spanish | 95.5 /100 | #118 | Exceptional 1.9% |
| Iroquois | 95.1 /100 | #119 | Exceptional 1.9% |
| Immigrants | Bulgaria | 94.6 /100 | #120 | Exceptional 1.9% |
| Immigrants | Croatia | 94.5 /100 | #121 | Exceptional 1.9% |
Demographics Similar to Portuguese by No Schooling Completed
In terms of no schooling completed, the demographic groups most similar to Portuguese are Immigrants from Kazakhstan (2.1%, a difference of 0.060%), Pakistani (2.1%, a difference of 0.11%), Arapaho (2.1%, a difference of 0.16%), Panamanian (2.1%, a difference of 0.17%), and Immigrants from Taiwan (2.1%, a difference of 0.18%).
| Demographics | Rating | Rank | No Schooling Completed |
| Immigrants | Belarus | 51.8 /100 | #173 | Average 2.1% |
| Immigrants | Micronesia | 50.0 /100 | #174 | Average 2.1% |
| Arabs | 46.4 /100 | #175 | Average 2.1% |
| Panamanians | 45.2 /100 | #176 | Average 2.1% |
| Arapaho | 45.0 /100 | #177 | Average 2.1% |
| Pakistanis | 44.7 /100 | #178 | Average 2.1% |
| Immigrants | Kazakhstan | 44.3 /100 | #179 | Average 2.1% |
| Portuguese | 43.9 /100 | #180 | Average 2.1% |
| Immigrants | Taiwan | 42.6 /100 | #181 | Average 2.1% |
| French American Indians | 42.2 /100 | #182 | Average 2.1% |
| Blacks/African Americans | 41.4 /100 | #183 | Average 2.1% |
| Pima | 41.3 /100 | #184 | Average 2.1% |
| Mongolians | 40.8 /100 | #185 | Average 2.1% |
| Immigrants | Bosnia and Herzegovina | 38.6 /100 | #186 | Fair 2.1% |
| Navajo | 36.5 /100 | #187 | Fair 2.1% |