Immigrants from Northern Europe vs Bhutanese Professional Degree
COMPARE
Immigrants from Northern Europe
Bhutanese
Professional Degree
Professional Degree Comparison
Immigrants from Northern Europe
Bhutanese
6.2%
PROFESSIONAL DEGREE
100.0/ 100
METRIC RATING
27th/ 347
METRIC RANK
5.4%
PROFESSIONAL DEGREE
99.8/ 100
METRIC RATING
70th/ 347
METRIC RANK
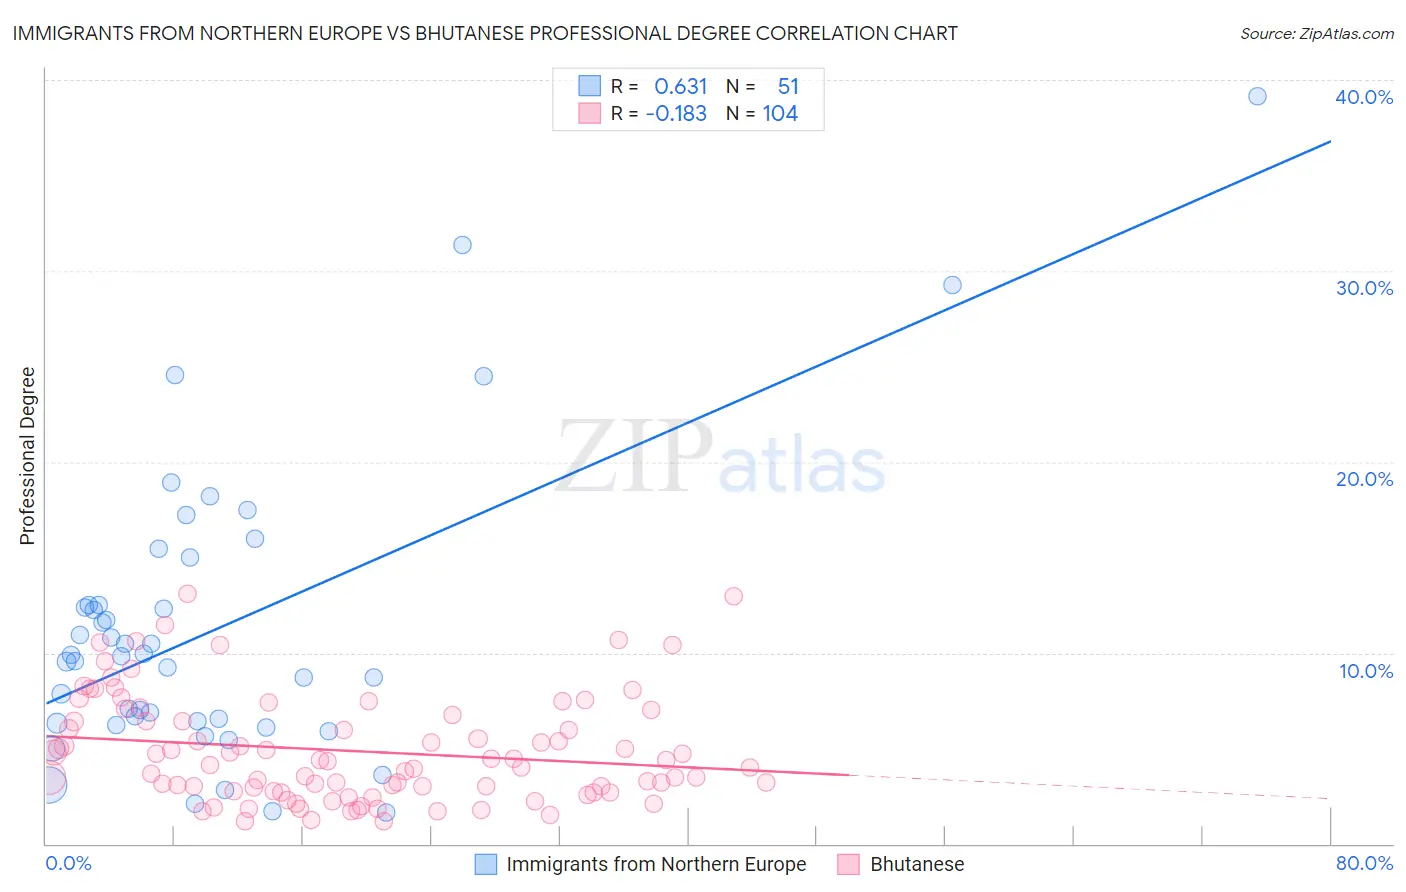
Immigrants from Northern Europe vs Bhutanese Professional Degree Correlation Chart
The statistical analysis conducted on geographies consisting of 475,703,825 people shows a significant positive correlation between the proportion of Immigrants from Northern Europe and percentage of population with at least professional degree education in the United States with a correlation coefficient (R) of 0.631 and weighted average of 6.2%. Similarly, the statistical analysis conducted on geographies consisting of 454,048,564 people shows a poor negative correlation between the proportion of Bhutanese and percentage of population with at least professional degree education in the United States with a correlation coefficient (R) of -0.183 and weighted average of 5.4%, a difference of 14.2%.
Professional Degree Correlation Summary
| Measurement | Immigrants from Northern Europe | Bhutanese |
| Minimum | 1.7% | 1.2% |
| Maximum | 39.2% | 13.1% |
| Range | 37.5% | 12.0% |
| Mean | 11.3% | 4.9% |
| Median | 9.8% | 4.2% |
| Interquartile 25% (IQ1) | 6.3% | 2.7% |
| Interquartile 75% (IQ3) | 12.5% | 6.6% |
| Interquartile Range (IQR) | 6.2% | 3.8% |
| Standard Deviation (Sample) | 7.7% | 2.8% |
| Standard Deviation (Population) | 7.6% | 2.8% |
Similar Demographics by Professional Degree
Demographics Similar to Immigrants from Northern Europe by Professional Degree
In terms of professional degree, the demographic groups most similar to Immigrants from Northern Europe are Turkish (6.2%, a difference of 0.11%), Latvian (6.2%, a difference of 0.50%), Immigrants from Sri Lanka (6.2%, a difference of 0.75%), Immigrants from Turkey (6.2%, a difference of 0.75%), and Immigrants from India (6.2%, a difference of 0.87%).
| Demographics | Rating | Rank | Professional Degree |
| Immigrants | Denmark | 100.0 /100 | #20 | Exceptional 6.4% |
| Immigrants | Hong Kong | 100.0 /100 | #21 | Exceptional 6.4% |
| Immigrants | Japan | 100.0 /100 | #22 | Exceptional 6.4% |
| Russians | 100.0 /100 | #23 | Exceptional 6.3% |
| Immigrants | Spain | 100.0 /100 | #24 | Exceptional 6.3% |
| Immigrants | Ireland | 100.0 /100 | #25 | Exceptional 6.3% |
| Latvians | 100.0 /100 | #26 | Exceptional 6.2% |
| Immigrants | Northern Europe | 100.0 /100 | #27 | Exceptional 6.2% |
| Turks | 100.0 /100 | #28 | Exceptional 6.2% |
| Immigrants | Sri Lanka | 100.0 /100 | #29 | Exceptional 6.2% |
| Immigrants | Turkey | 100.0 /100 | #30 | Exceptional 6.2% |
| Immigrants | India | 100.0 /100 | #31 | Exceptional 6.2% |
| Thais | 100.0 /100 | #32 | Exceptional 6.1% |
| Burmese | 100.0 /100 | #33 | Exceptional 6.1% |
| Mongolians | 100.0 /100 | #34 | Exceptional 6.1% |
Demographics Similar to Bhutanese by Professional Degree
In terms of professional degree, the demographic groups most similar to Bhutanese are Immigrants from Hungary (5.5%, a difference of 0.33%), Immigrants from Lebanon (5.5%, a difference of 0.41%), Immigrants from Bulgaria (5.5%, a difference of 0.59%), Immigrants from Western Asia (5.4%, a difference of 0.59%), and Immigrants from Kazakhstan (5.5%, a difference of 0.92%).
| Demographics | Rating | Rank | Professional Degree |
| Asians | 99.9 /100 | #63 | Exceptional 5.5% |
| Immigrants | Asia | 99.9 /100 | #64 | Exceptional 5.5% |
| Immigrants | Bolivia | 99.9 /100 | #65 | Exceptional 5.5% |
| Immigrants | Kazakhstan | 99.9 /100 | #66 | Exceptional 5.5% |
| Immigrants | Bulgaria | 99.9 /100 | #67 | Exceptional 5.5% |
| Immigrants | Lebanon | 99.9 /100 | #68 | Exceptional 5.5% |
| Immigrants | Hungary | 99.9 /100 | #69 | Exceptional 5.5% |
| Bhutanese | 99.8 /100 | #70 | Exceptional 5.4% |
| Immigrants | Western Asia | 99.8 /100 | #71 | Exceptional 5.4% |
| Lithuanians | 99.8 /100 | #72 | Exceptional 5.4% |
| Immigrants | Romania | 99.8 /100 | #73 | Exceptional 5.4% |
| Ethiopians | 99.7 /100 | #74 | Exceptional 5.4% |
| Immigrants | Indonesia | 99.7 /100 | #75 | Exceptional 5.3% |
| Immigrants | Canada | 99.7 /100 | #76 | Exceptional 5.3% |
| Immigrants | Ethiopia | 99.7 /100 | #77 | Exceptional 5.3% |