Immigrants from Belarus vs Brazilian 1st Grade
COMPARE
Immigrants from Belarus
Brazilian
1st Grade
1st Grade Comparison
Immigrants from Belarus
Brazilians
97.9%
1ST GRADE
39.3/ 100
METRIC RATING
185th/ 347
METRIC RANK
97.9%
1ST GRADE
57.6/ 100
METRIC RATING
164th/ 347
METRIC RANK
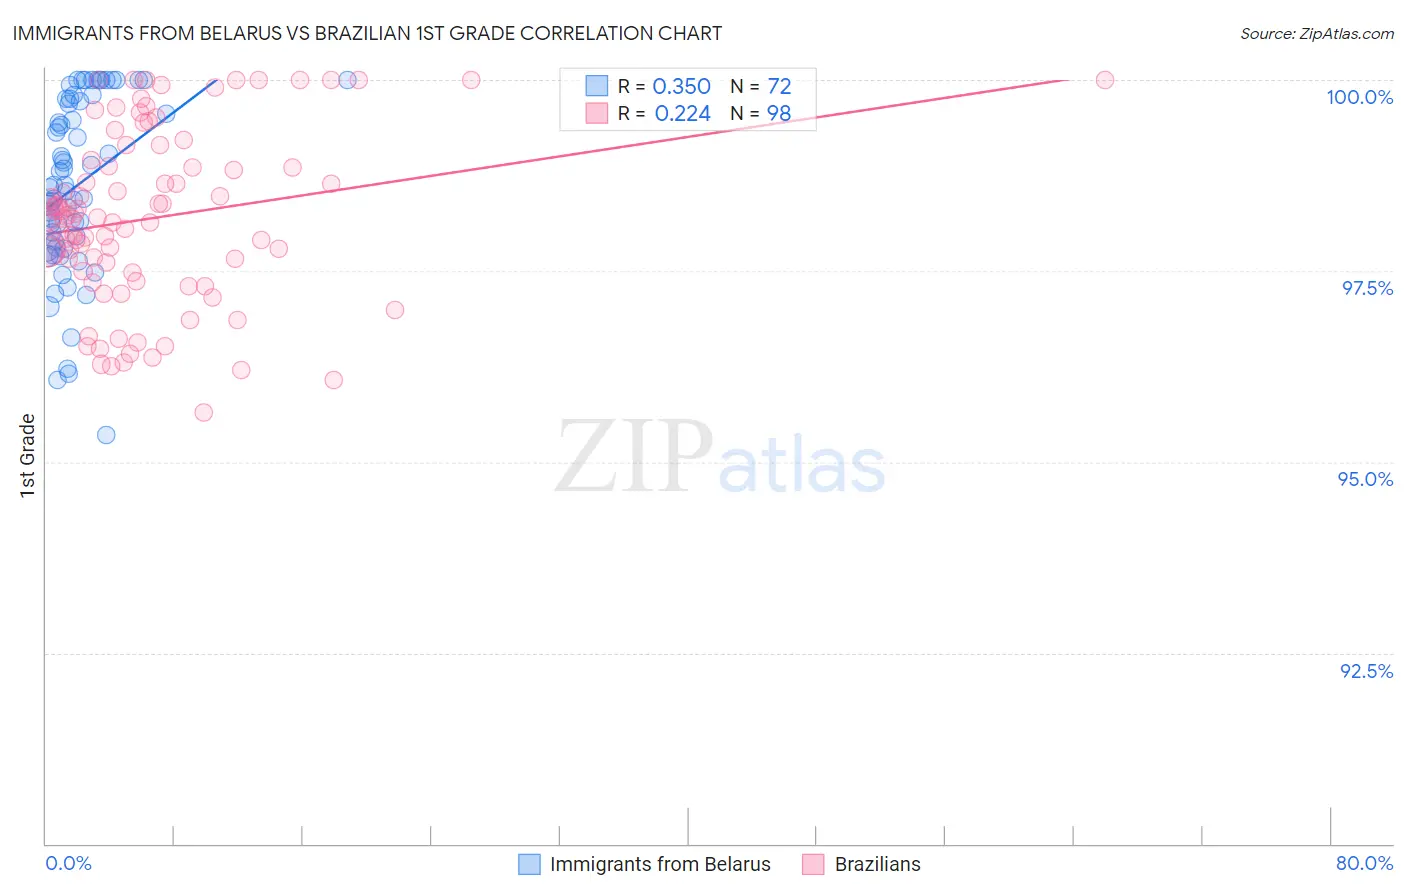
Immigrants from Belarus vs Brazilian 1st Grade Correlation Chart
The statistical analysis conducted on geographies consisting of 149,993,317 people shows a mild positive correlation between the proportion of Immigrants from Belarus and percentage of population with at least 1st grade education in the United States with a correlation coefficient (R) of 0.350 and weighted average of 97.9%. Similarly, the statistical analysis conducted on geographies consisting of 323,863,770 people shows a weak positive correlation between the proportion of Brazilians and percentage of population with at least 1st grade education in the United States with a correlation coefficient (R) of 0.224 and weighted average of 97.9%, a difference of 0.060%.
1st Grade Correlation Summary
| Measurement | Immigrants from Belarus | Brazilian |
| Minimum | 95.4% | 95.6% |
| Maximum | 100.0% | 100.0% |
| Range | 4.6% | 4.4% |
| Mean | 98.6% | 98.2% |
| Median | 98.6% | 98.2% |
| Interquartile 25% (IQ1) | 97.8% | 97.5% |
| Interquartile 75% (IQ3) | 99.7% | 99.0% |
| Interquartile Range (IQR) | 1.9% | 1.5% |
| Standard Deviation (Sample) | 1.1% | 1.1% |
| Standard Deviation (Population) | 1.1% | 1.1% |
Similar Demographics by 1st Grade
Demographics Similar to Immigrants from Belarus by 1st Grade
In terms of 1st grade, the demographic groups most similar to Immigrants from Belarus are Immigrants from Poland (97.9%, a difference of 0.0%), Egyptian (97.9%, a difference of 0.010%), Immigrants from Argentina (97.9%, a difference of 0.010%), Paiute (97.9%, a difference of 0.010%), and Pakistani (97.9%, a difference of 0.010%).
| Demographics | Rating | Rank | 1st Grade |
| Immigrants | Venezuela | 47.8 /100 | #178 | Average 97.9% |
| Argentineans | 47.2 /100 | #179 | Average 97.9% |
| Immigrants | Bosnia and Herzegovina | 46.6 /100 | #180 | Average 97.9% |
| Portuguese | 44.2 /100 | #181 | Average 97.9% |
| Egyptians | 42.7 /100 | #182 | Average 97.9% |
| Immigrants | Argentina | 41.3 /100 | #183 | Average 97.9% |
| Immigrants | Poland | 40.1 /100 | #184 | Average 97.9% |
| Immigrants | Belarus | 39.3 /100 | #185 | Fair 97.9% |
| Paiute | 36.5 /100 | #186 | Fair 97.9% |
| Pakistanis | 35.8 /100 | #187 | Fair 97.9% |
| Arabs | 35.5 /100 | #188 | Fair 97.9% |
| Immigrants | Kazakhstan | 34.9 /100 | #189 | Fair 97.9% |
| Panamanians | 34.1 /100 | #190 | Fair 97.9% |
| Blacks/African Americans | 30.7 /100 | #191 | Fair 97.9% |
| Paraguayans | 30.2 /100 | #192 | Fair 97.9% |
Demographics Similar to Brazilians by 1st Grade
In terms of 1st grade, the demographic groups most similar to Brazilians are Immigrants from Italy (97.9%, a difference of 0.0%), Immigrants from Eastern Europe (97.9%, a difference of 0.0%), Spanish American (97.9%, a difference of 0.0%), Ugandan (97.9%, a difference of 0.0%), and Navajo (97.9%, a difference of 0.0%).
| Demographics | Rating | Rank | 1st Grade |
| Immigrants | North Macedonia | 65.3 /100 | #157 | Good 98.0% |
| Venezuelans | 64.7 /100 | #158 | Good 98.0% |
| French American Indians | 63.7 /100 | #159 | Good 98.0% |
| Immigrants | Russia | 59.2 /100 | #160 | Average 97.9% |
| Immigrants | Italy | 59.1 /100 | #161 | Average 97.9% |
| Immigrants | Eastern Europe | 58.9 /100 | #162 | Average 97.9% |
| Spanish Americans | 57.7 /100 | #163 | Average 97.9% |
| Brazilians | 57.6 /100 | #164 | Average 97.9% |
| Ugandans | 56.9 /100 | #165 | Average 97.9% |
| Navajo | 56.6 /100 | #166 | Average 97.9% |
| Bermudans | 56.3 /100 | #167 | Average 97.9% |
| Chileans | 55.6 /100 | #168 | Average 97.9% |
| Immigrants | Micronesia | 55.3 /100 | #169 | Average 97.9% |
| Immigrants | Spain | 54.9 /100 | #170 | Average 97.9% |
| Immigrants | Jordan | 53.9 /100 | #171 | Average 97.9% |