Immigrants from North Macedonia vs Hawaiian 11th Grade
COMPARE
Immigrants from North Macedonia
Hawaiian
11th Grade
11th Grade Comparison
Immigrants from North Macedonia
Hawaiians
93.5%
11TH GRADE
98.7/ 100
METRIC RATING
100th/ 347
METRIC RANK
92.3%
11TH GRADE
25.5/ 100
METRIC RATING
198th/ 347
METRIC RANK
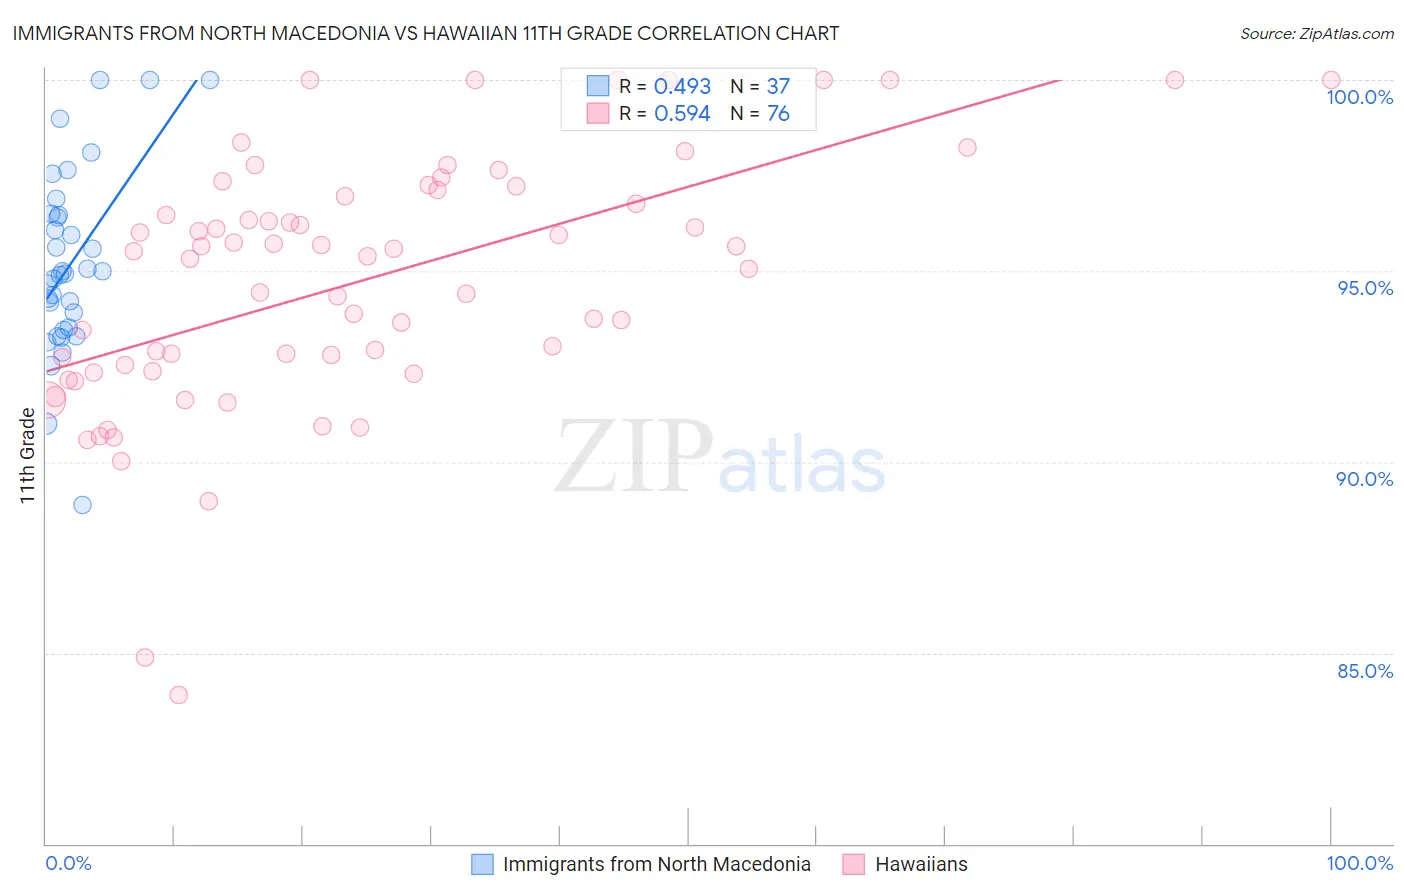
Immigrants from North Macedonia vs Hawaiian 11th Grade Correlation Chart
The statistical analysis conducted on geographies consisting of 74,300,344 people shows a moderate positive correlation between the proportion of Immigrants from North Macedonia and percentage of population with at least 11th grade education in the United States with a correlation coefficient (R) of 0.493 and weighted average of 93.5%. Similarly, the statistical analysis conducted on geographies consisting of 327,620,881 people shows a substantial positive correlation between the proportion of Hawaiians and percentage of population with at least 11th grade education in the United States with a correlation coefficient (R) of 0.594 and weighted average of 92.3%, a difference of 1.3%.
11th Grade Correlation Summary
| Measurement | Immigrants from North Macedonia | Hawaiian |
| Minimum | 88.9% | 83.9% |
| Maximum | 100.0% | 100.0% |
| Range | 11.1% | 16.1% |
| Mean | 95.2% | 94.7% |
| Median | 94.9% | 95.5% |
| Interquartile 25% (IQ1) | 93.5% | 92.5% |
| Interquartile 75% (IQ3) | 96.5% | 97.0% |
| Interquartile Range (IQR) | 3.0% | 4.6% |
| Standard Deviation (Sample) | 2.4% | 3.3% |
| Standard Deviation (Population) | 2.4% | 3.3% |
Similar Demographics by 11th Grade
Demographics Similar to Immigrants from North Macedonia by 11th Grade
In terms of 11th grade, the demographic groups most similar to Immigrants from North Macedonia are Immigrants from Israel (93.5%, a difference of 0.010%), Menominee (93.5%, a difference of 0.010%), Immigrants from Romania (93.5%, a difference of 0.010%), Chippewa (93.5%, a difference of 0.020%), and Lebanese (93.5%, a difference of 0.020%).
| Demographics | Rating | Rank | 11th Grade |
| Puget Sound Salish | 99.1 /100 | #93 | Exceptional 93.6% |
| Swiss | 99.0 /100 | #94 | Exceptional 93.6% |
| Immigrants | France | 99.0 /100 | #95 | Exceptional 93.6% |
| Immigrants | Turkey | 98.9 /100 | #96 | Exceptional 93.5% |
| Immigrants | Iran | 98.9 /100 | #97 | Exceptional 93.5% |
| Immigrants | Israel | 98.8 /100 | #98 | Exceptional 93.5% |
| Menominee | 98.7 /100 | #99 | Exceptional 93.5% |
| Immigrants | North Macedonia | 98.7 /100 | #100 | Exceptional 93.5% |
| Immigrants | Romania | 98.7 /100 | #101 | Exceptional 93.5% |
| Chippewa | 98.6 /100 | #102 | Exceptional 93.5% |
| Lebanese | 98.6 /100 | #103 | Exceptional 93.5% |
| Immigrants | Europe | 98.6 /100 | #104 | Exceptional 93.5% |
| Immigrants | Serbia | 98.6 /100 | #105 | Exceptional 93.5% |
| Immigrants | Croatia | 98.6 /100 | #106 | Exceptional 93.5% |
| Immigrants | Norway | 98.4 /100 | #107 | Exceptional 93.5% |
Demographics Similar to Hawaiians by 11th Grade
In terms of 11th grade, the demographic groups most similar to Hawaiians are Immigrants from Uganda (92.3%, a difference of 0.0%), Panamanian (92.3%, a difference of 0.010%), Marshallese (92.3%, a difference of 0.010%), Samoan (92.3%, a difference of 0.010%), and Immigrants from China (92.3%, a difference of 0.010%).
| Demographics | Rating | Rank | 11th Grade |
| French American Indians | 30.8 /100 | #191 | Fair 92.3% |
| Immigrants | Syria | 30.4 /100 | #192 | Fair 92.3% |
| Moroccans | 28.7 /100 | #193 | Fair 92.3% |
| Sioux | 28.5 /100 | #194 | Fair 92.3% |
| Liberians | 26.8 /100 | #195 | Fair 92.3% |
| Panamanians | 26.4 /100 | #196 | Fair 92.3% |
| Marshallese | 26.0 /100 | #197 | Fair 92.3% |
| Hawaiians | 25.5 /100 | #198 | Fair 92.3% |
| Immigrants | Uganda | 25.2 /100 | #199 | Fair 92.3% |
| Samoans | 25.1 /100 | #200 | Fair 92.3% |
| Immigrants | China | 25.1 /100 | #201 | Fair 92.3% |
| Immigrants | Eastern Africa | 24.1 /100 | #202 | Fair 92.3% |
| Immigrants | Sudan | 23.5 /100 | #203 | Fair 92.3% |
| Immigrants | Hong Kong | 23.3 /100 | #204 | Fair 92.2% |
| Kiowa | 23.2 /100 | #205 | Fair 92.2% |