Immigrants from North America vs Sri Lankan Doctorate Degree
COMPARE
Immigrants from North America
Sri Lankan
Doctorate Degree
Doctorate Degree Comparison
Immigrants from North America
Sri Lankans
2.2%
DOCTORATE DEGREE
99.8/ 100
METRIC RATING
74th/ 347
METRIC RANK
1.9%
DOCTORATE DEGREE
60.3/ 100
METRIC RATING
168th/ 347
METRIC RANK
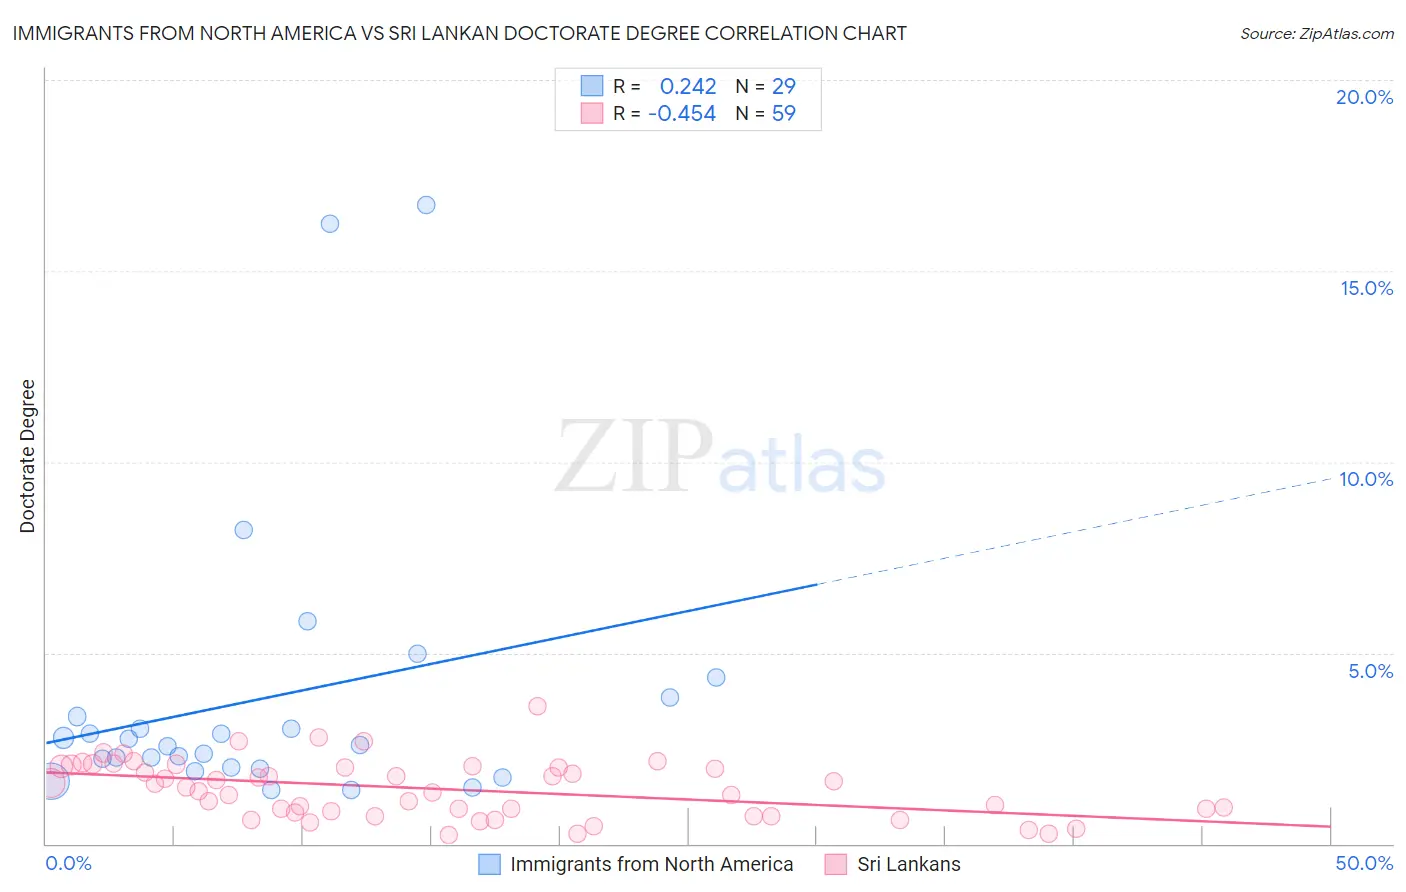
Immigrants from North America vs Sri Lankan Doctorate Degree Correlation Chart
The statistical analysis conducted on geographies consisting of 455,963,047 people shows a weak positive correlation between the proportion of Immigrants from North America and percentage of population with at least doctorate degree education in the United States with a correlation coefficient (R) of 0.242 and weighted average of 2.2%. Similarly, the statistical analysis conducted on geographies consisting of 435,479,359 people shows a moderate negative correlation between the proportion of Sri Lankans and percentage of population with at least doctorate degree education in the United States with a correlation coefficient (R) of -0.454 and weighted average of 1.9%, a difference of 20.5%.
Doctorate Degree Correlation Summary
| Measurement | Immigrants from North America | Sri Lankan |
| Minimum | 1.4% | 0.22% |
| Maximum | 16.7% | 3.6% |
| Range | 15.3% | 3.4% |
| Mean | 3.8% | 1.4% |
| Median | 2.6% | 1.5% |
| Interquartile 25% (IQ1) | 2.0% | 0.83% |
| Interquartile 75% (IQ3) | 3.6% | 2.0% |
| Interquartile Range (IQR) | 1.6% | 1.2% |
| Standard Deviation (Sample) | 3.8% | 0.75% |
| Standard Deviation (Population) | 3.7% | 0.74% |
Similar Demographics by Doctorate Degree
Demographics Similar to Immigrants from North America by Doctorate Degree
In terms of doctorate degree, the demographic groups most similar to Immigrants from North America are Immigrants from Western Asia (2.2%, a difference of 0.10%), Immigrants from Bulgaria (2.3%, a difference of 0.14%), Immigrants from Hungary (2.2%, a difference of 0.18%), Immigrants from Lebanon (2.2%, a difference of 0.18%), and Immigrants from Canada (2.3%, a difference of 0.22%).
| Demographics | Rating | Rank | Doctorate Degree |
| Zimbabweans | 99.8 /100 | #67 | Exceptional 2.3% |
| Immigrants | Kazakhstan | 99.8 /100 | #68 | Exceptional 2.3% |
| Carpatho Rusyns | 99.8 /100 | #69 | Exceptional 2.3% |
| Lithuanians | 99.8 /100 | #70 | Exceptional 2.3% |
| Immigrants | Bolivia | 99.8 /100 | #71 | Exceptional 2.3% |
| Immigrants | Canada | 99.8 /100 | #72 | Exceptional 2.3% |
| Immigrants | Bulgaria | 99.8 /100 | #73 | Exceptional 2.3% |
| Immigrants | North America | 99.8 /100 | #74 | Exceptional 2.2% |
| Immigrants | Western Asia | 99.8 /100 | #75 | Exceptional 2.2% |
| Immigrants | Hungary | 99.8 /100 | #76 | Exceptional 2.2% |
| Immigrants | Lebanon | 99.8 /100 | #77 | Exceptional 2.2% |
| Immigrants | Belarus | 99.7 /100 | #78 | Exceptional 2.2% |
| Northern Europeans | 99.7 /100 | #79 | Exceptional 2.2% |
| Ugandans | 99.7 /100 | #80 | Exceptional 2.2% |
| Immigrants | Argentina | 99.7 /100 | #81 | Exceptional 2.2% |
Demographics Similar to Sri Lankans by Doctorate Degree
In terms of doctorate degree, the demographic groups most similar to Sri Lankans are Macedonian (1.9%, a difference of 0.10%), Spaniard (1.9%, a difference of 0.49%), Scotch-Irish (1.9%, a difference of 0.51%), Vietnamese (1.9%, a difference of 0.82%), and Celtic (1.9%, a difference of 1.0%).
| Demographics | Rating | Rank | Doctorate Degree |
| Immigrants | Middle Africa | 68.8 /100 | #161 | Good 1.9% |
| Irish | 67.5 /100 | #162 | Good 1.9% |
| Czechs | 67.3 /100 | #163 | Good 1.9% |
| Celtics | 66.7 /100 | #164 | Good 1.9% |
| Scotch-Irish | 63.6 /100 | #165 | Good 1.9% |
| Spaniards | 63.5 /100 | #166 | Good 1.9% |
| Macedonians | 60.9 /100 | #167 | Good 1.9% |
| Sri Lankans | 60.3 /100 | #168 | Good 1.9% |
| Vietnamese | 54.8 /100 | #169 | Average 1.9% |
| Costa Ricans | 53.3 /100 | #170 | Average 1.8% |
| Bermudans | 52.1 /100 | #171 | Average 1.8% |
| Belgians | 50.3 /100 | #172 | Average 1.8% |
| Norwegians | 50.0 /100 | #173 | Average 1.8% |
| Immigrants | Bangladesh | 50.0 /100 | #174 | Average 1.8% |
| Immigrants | Thailand | 49.4 /100 | #175 | Average 1.8% |