Immigrants from Latvia vs Sri Lankan Doctorate Degree
COMPARE
Immigrants from Latvia
Sri Lankan
Doctorate Degree
Doctorate Degree Comparison
Immigrants from Latvia
Sri Lankans
2.4%
DOCTORATE DEGREE
100.0/ 100
METRIC RATING
53rd/ 347
METRIC RANK
1.9%
DOCTORATE DEGREE
60.3/ 100
METRIC RATING
168th/ 347
METRIC RANK
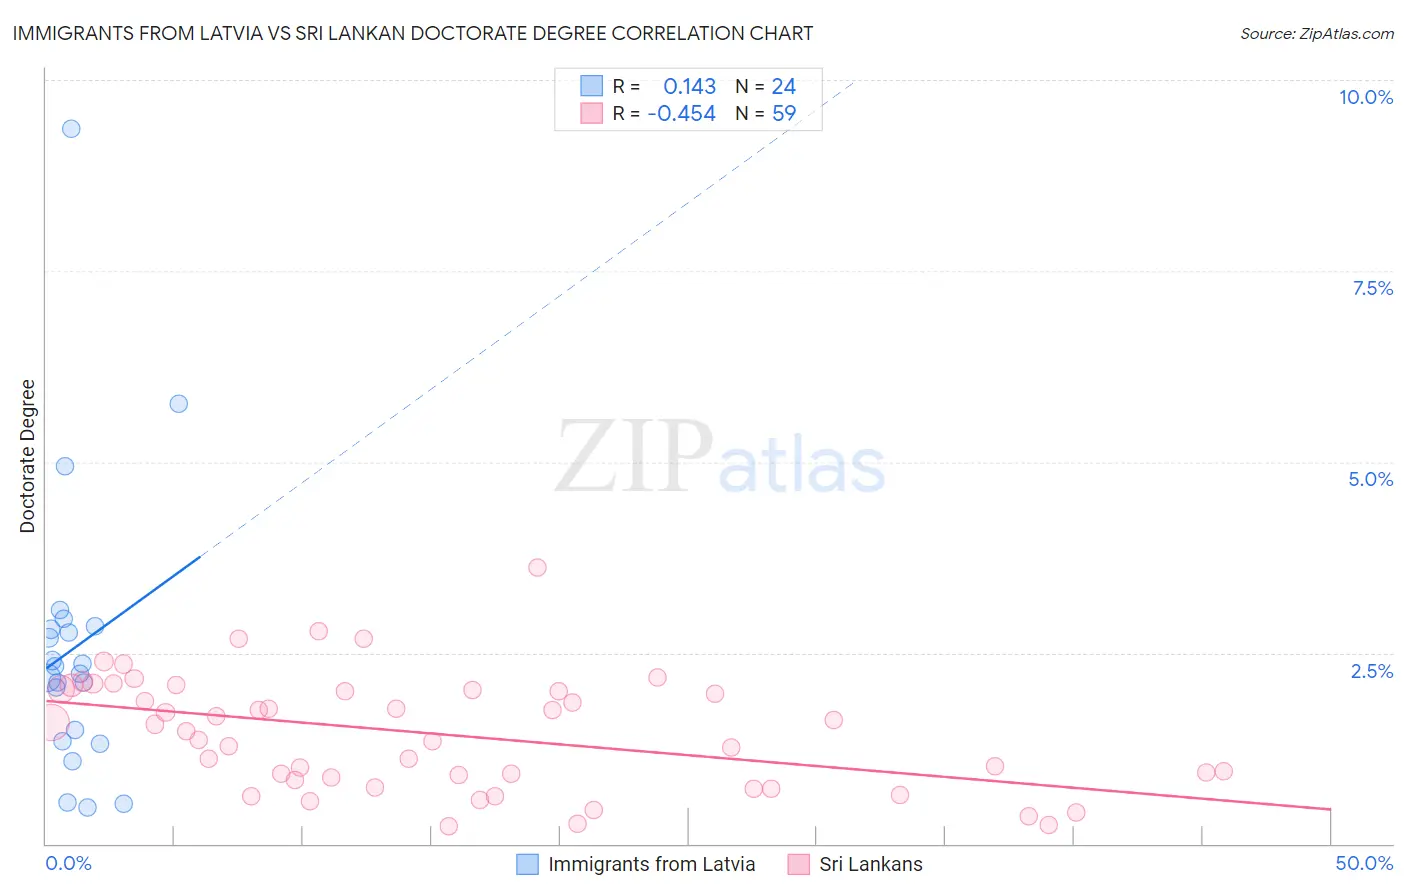
Immigrants from Latvia vs Sri Lankan Doctorate Degree Correlation Chart
The statistical analysis conducted on geographies consisting of 113,595,553 people shows a poor positive correlation between the proportion of Immigrants from Latvia and percentage of population with at least doctorate degree education in the United States with a correlation coefficient (R) of 0.143 and weighted average of 2.4%. Similarly, the statistical analysis conducted on geographies consisting of 435,479,359 people shows a moderate negative correlation between the proportion of Sri Lankans and percentage of population with at least doctorate degree education in the United States with a correlation coefficient (R) of -0.454 and weighted average of 1.9%, a difference of 27.7%.
Doctorate Degree Correlation Summary
| Measurement | Immigrants from Latvia | Sri Lankan |
| Minimum | 0.48% | 0.22% |
| Maximum | 9.4% | 3.6% |
| Range | 8.9% | 3.4% |
| Mean | 2.6% | 1.4% |
| Median | 2.3% | 1.5% |
| Interquartile 25% (IQ1) | 1.4% | 0.83% |
| Interquartile 75% (IQ3) | 2.8% | 2.0% |
| Interquartile Range (IQR) | 1.4% | 1.2% |
| Standard Deviation (Sample) | 1.9% | 0.75% |
| Standard Deviation (Population) | 1.9% | 0.74% |
Similar Demographics by Doctorate Degree
Demographics Similar to Immigrants from Latvia by Doctorate Degree
In terms of doctorate degree, the demographic groups most similar to Immigrants from Latvia are Bulgarian (2.4%, a difference of 0.12%), Australian (2.4%, a difference of 0.59%), Immigrants from Norway (2.4%, a difference of 0.68%), Immigrants from Indonesia (2.4%, a difference of 0.68%), and Bolivian (2.4%, a difference of 0.76%).
| Demographics | Rating | Rank | Doctorate Degree |
| Immigrants | Austria | 100.0 /100 | #46 | Exceptional 2.4% |
| Immigrants | Western Europe | 100.0 /100 | #47 | Exceptional 2.4% |
| Asians | 100.0 /100 | #48 | Exceptional 2.4% |
| Immigrants | Asia | 100.0 /100 | #49 | Exceptional 2.4% |
| Immigrants | Norway | 100.0 /100 | #50 | Exceptional 2.4% |
| Australians | 100.0 /100 | #51 | Exceptional 2.4% |
| Bulgarians | 100.0 /100 | #52 | Exceptional 2.4% |
| Immigrants | Latvia | 100.0 /100 | #53 | Exceptional 2.4% |
| Immigrants | Indonesia | 100.0 /100 | #54 | Exceptional 2.4% |
| Bolivians | 100.0 /100 | #55 | Exceptional 2.4% |
| Immigrants | Czechoslovakia | 100.0 /100 | #56 | Exceptional 2.4% |
| Immigrants | Ethiopia | 100.0 /100 | #57 | Exceptional 2.4% |
| Ethiopians | 99.9 /100 | #58 | Exceptional 2.3% |
| South Africans | 99.9 /100 | #59 | Exceptional 2.3% |
| Immigrants | Serbia | 99.9 /100 | #60 | Exceptional 2.3% |
Demographics Similar to Sri Lankans by Doctorate Degree
In terms of doctorate degree, the demographic groups most similar to Sri Lankans are Macedonian (1.9%, a difference of 0.10%), Spaniard (1.9%, a difference of 0.49%), Scotch-Irish (1.9%, a difference of 0.51%), Vietnamese (1.9%, a difference of 0.82%), and Celtic (1.9%, a difference of 1.0%).
| Demographics | Rating | Rank | Doctorate Degree |
| Immigrants | Middle Africa | 68.8 /100 | #161 | Good 1.9% |
| Irish | 67.5 /100 | #162 | Good 1.9% |
| Czechs | 67.3 /100 | #163 | Good 1.9% |
| Celtics | 66.7 /100 | #164 | Good 1.9% |
| Scotch-Irish | 63.6 /100 | #165 | Good 1.9% |
| Spaniards | 63.5 /100 | #166 | Good 1.9% |
| Macedonians | 60.9 /100 | #167 | Good 1.9% |
| Sri Lankans | 60.3 /100 | #168 | Good 1.9% |
| Vietnamese | 54.8 /100 | #169 | Average 1.9% |
| Costa Ricans | 53.3 /100 | #170 | Average 1.8% |
| Bermudans | 52.1 /100 | #171 | Average 1.8% |
| Belgians | 50.3 /100 | #172 | Average 1.8% |
| Norwegians | 50.0 /100 | #173 | Average 1.8% |
| Immigrants | Bangladesh | 50.0 /100 | #174 | Average 1.8% |
| Immigrants | Thailand | 49.4 /100 | #175 | Average 1.8% |