Immigrants from North America vs Immigrants from Venezuela Kindergarten
COMPARE
Immigrants from North America
Immigrants from Venezuela
Kindergarten
Kindergarten Comparison
Immigrants from North America
Immigrants from Venezuela
98.4%
KINDERGARTEN
99.7/ 100
METRIC RATING
63rd/ 347
METRIC RANK
97.9%
KINDERGARTEN
47.9/ 100
METRIC RATING
177th/ 347
METRIC RANK
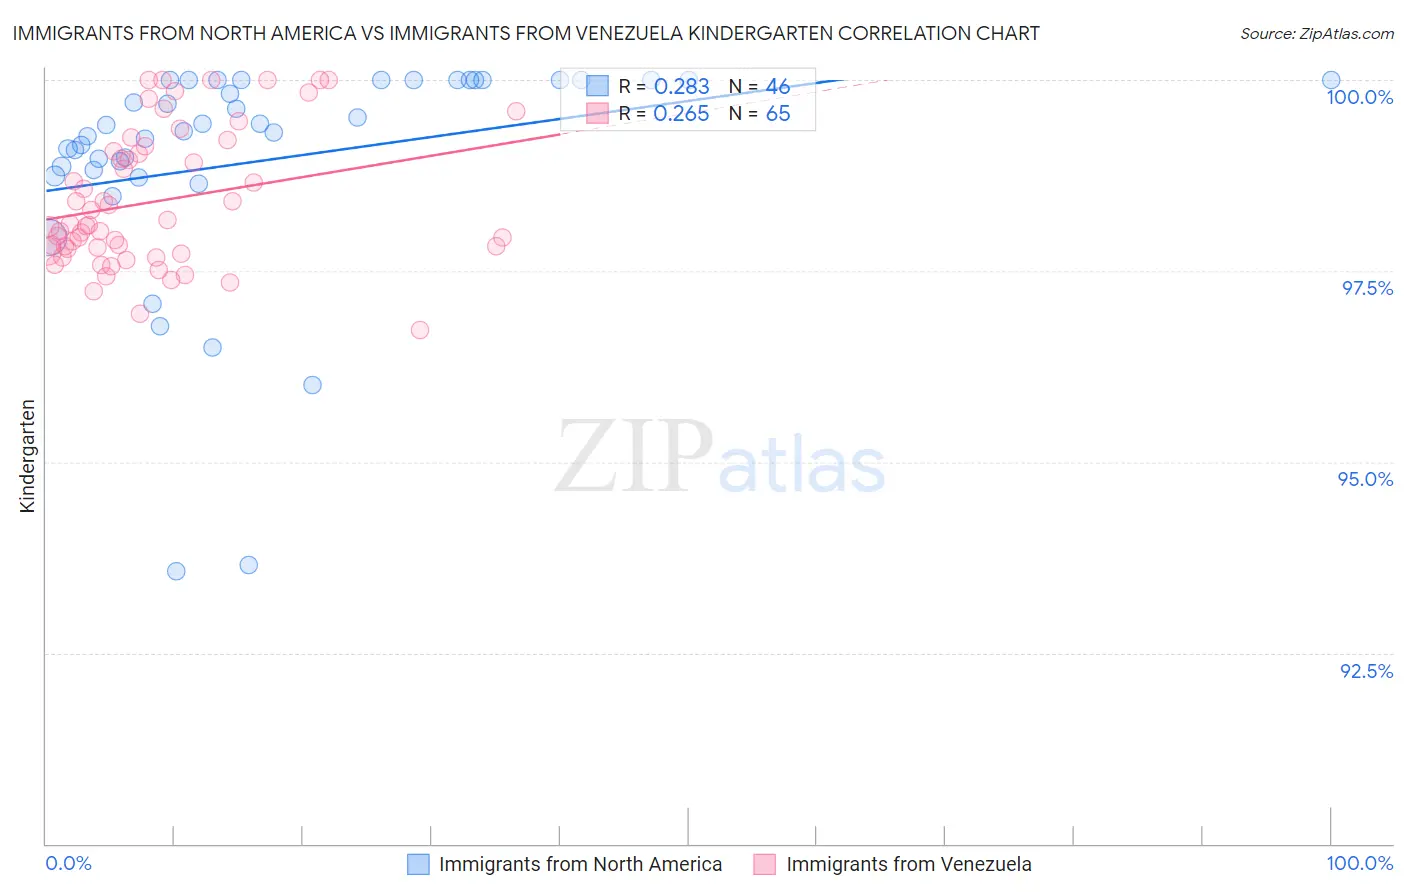
Immigrants from North America vs Immigrants from Venezuela Kindergarten Correlation Chart
The statistical analysis conducted on geographies consisting of 462,462,400 people shows a weak positive correlation between the proportion of Immigrants from North America and percentage of population with at least kindergarten education in the United States with a correlation coefficient (R) of 0.283 and weighted average of 98.4%. Similarly, the statistical analysis conducted on geographies consisting of 287,866,009 people shows a weak positive correlation between the proportion of Immigrants from Venezuela and percentage of population with at least kindergarten education in the United States with a correlation coefficient (R) of 0.265 and weighted average of 97.9%, a difference of 0.46%.
Kindergarten Correlation Summary
| Measurement | Immigrants from North America | Immigrants from Venezuela |
| Minimum | 93.6% | 96.7% |
| Maximum | 100.0% | 100.0% |
| Range | 6.4% | 3.3% |
| Mean | 99.0% | 98.4% |
| Median | 99.4% | 98.1% |
| Interquartile 25% (IQ1) | 98.8% | 97.8% |
| Interquartile 75% (IQ3) | 100.0% | 99.1% |
| Interquartile Range (IQR) | 1.2% | 1.3% |
| Standard Deviation (Sample) | 1.5% | 0.88% |
| Standard Deviation (Population) | 1.5% | 0.88% |
Similar Demographics by Kindergarten
Demographics Similar to Immigrants from North America by Kindergarten
In terms of kindergarten, the demographic groups most similar to Immigrants from North America are Immigrants from Canada (98.4%, a difference of 0.0%), Creek (98.4%, a difference of 0.0%), Slavic (98.4%, a difference of 0.0%), New Zealander (98.4%, a difference of 0.0%), and Greek (98.4%, a difference of 0.0%).
| Demographics | Rating | Rank | Kindergarten |
| Americans | 99.8 /100 | #56 | Exceptional 98.4% |
| Austrians | 99.8 /100 | #57 | Exceptional 98.4% |
| Bulgarians | 99.7 /100 | #58 | Exceptional 98.4% |
| Immigrants | Canada | 99.7 /100 | #59 | Exceptional 98.4% |
| Creek | 99.7 /100 | #60 | Exceptional 98.4% |
| Slavs | 99.7 /100 | #61 | Exceptional 98.4% |
| New Zealanders | 99.7 /100 | #62 | Exceptional 98.4% |
| Immigrants | North America | 99.7 /100 | #63 | Exceptional 98.4% |
| Greeks | 99.7 /100 | #64 | Exceptional 98.4% |
| Maltese | 99.7 /100 | #65 | Exceptional 98.4% |
| Cheyenne | 99.6 /100 | #66 | Exceptional 98.4% |
| Canadians | 99.6 /100 | #67 | Exceptional 98.4% |
| Immigrants | Northern Europe | 99.6 /100 | #68 | Exceptional 98.4% |
| Immigrants | Austria | 99.6 /100 | #69 | Exceptional 98.4% |
| Russians | 99.6 /100 | #70 | Exceptional 98.4% |
Demographics Similar to Immigrants from Venezuela by Kindergarten
In terms of kindergarten, the demographic groups most similar to Immigrants from Venezuela are Albanian (97.9%, a difference of 0.0%), Brazilian (97.9%, a difference of 0.0%), Argentinean (97.9%, a difference of 0.0%), Immigrants from Bosnia and Herzegovina (97.9%, a difference of 0.0%), and Native/Alaskan (98.0%, a difference of 0.010%).
| Demographics | Rating | Rank | Kindergarten |
| Bermudans | 54.0 /100 | #170 | Average 98.0% |
| Immigrants | Jordan | 54.0 /100 | #171 | Average 98.0% |
| Natives/Alaskans | 51.0 /100 | #172 | Average 98.0% |
| Kenyans | 51.0 /100 | #173 | Average 98.0% |
| Immigrants | Brazil | 50.0 /100 | #174 | Average 98.0% |
| Immigrants | Sri Lanka | 49.6 /100 | #175 | Average 97.9% |
| Albanians | 48.5 /100 | #176 | Average 97.9% |
| Immigrants | Venezuela | 47.9 /100 | #177 | Average 97.9% |
| Brazilians | 47.6 /100 | #178 | Average 97.9% |
| Argentineans | 46.8 /100 | #179 | Average 97.9% |
| Immigrants | Bosnia and Herzegovina | 46.7 /100 | #180 | Average 97.9% |
| Portuguese | 43.5 /100 | #181 | Average 97.9% |
| Egyptians | 42.4 /100 | #182 | Average 97.9% |
| Immigrants | Poland | 41.4 /100 | #183 | Average 97.9% |
| Immigrants | Argentina | 40.7 /100 | #184 | Average 97.9% |