Immigrants from North America vs Immigrants from Australia Kindergarten
COMPARE
Immigrants from North America
Immigrants from Australia
Kindergarten
Kindergarten Comparison
Immigrants from North America
Immigrants from Australia
98.4%
KINDERGARTEN
99.7/ 100
METRIC RATING
63rd/ 347
METRIC RANK
98.3%
KINDERGARTEN
99.0/ 100
METRIC RATING
87th/ 347
METRIC RANK
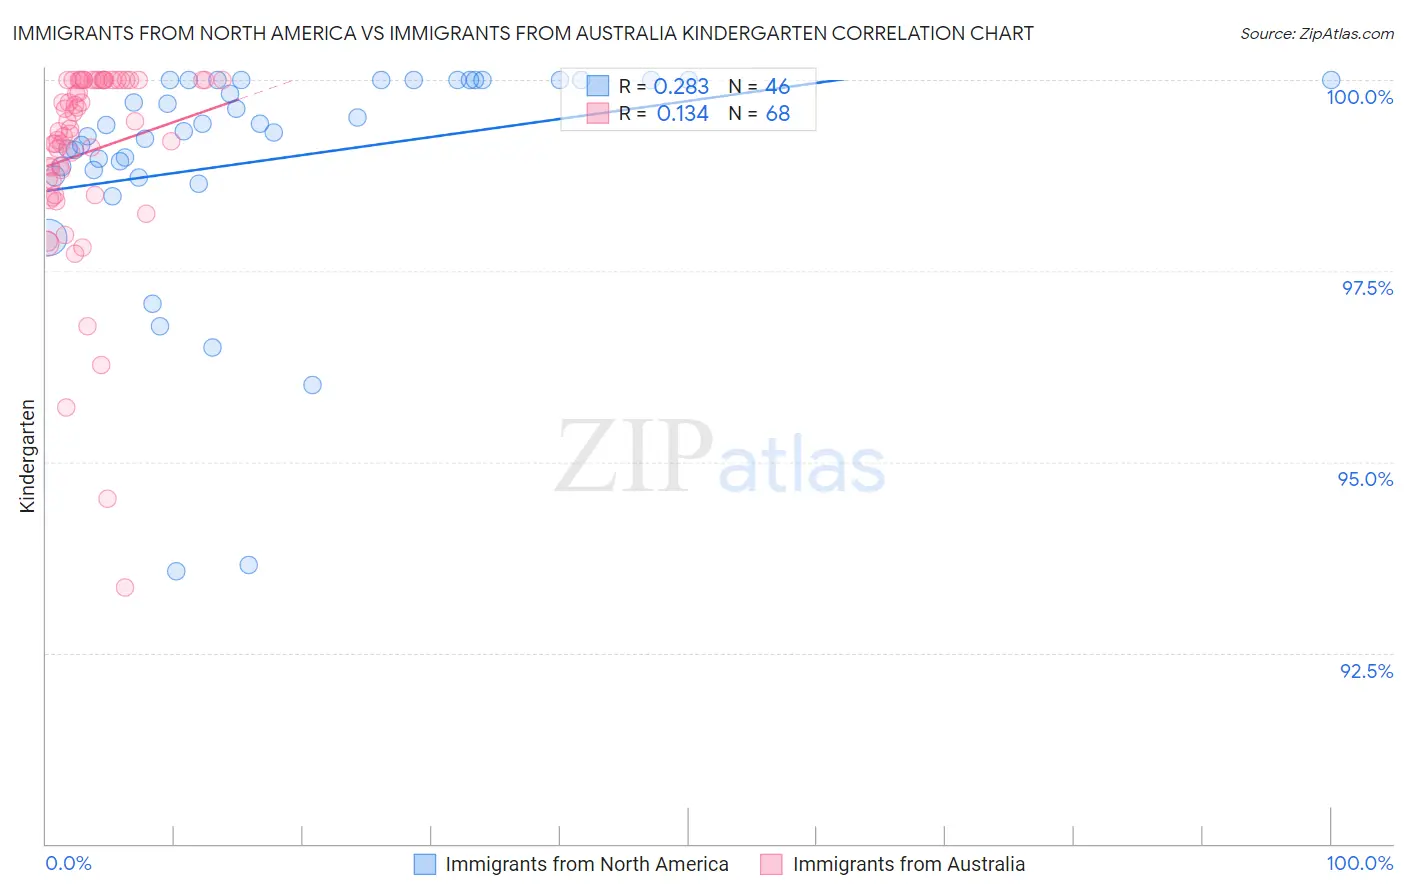
Immigrants from North America vs Immigrants from Australia Kindergarten Correlation Chart
The statistical analysis conducted on geographies consisting of 462,462,400 people shows a weak positive correlation between the proportion of Immigrants from North America and percentage of population with at least kindergarten education in the United States with a correlation coefficient (R) of 0.283 and weighted average of 98.4%. Similarly, the statistical analysis conducted on geographies consisting of 227,203,469 people shows a poor positive correlation between the proportion of Immigrants from Australia and percentage of population with at least kindergarten education in the United States with a correlation coefficient (R) of 0.134 and weighted average of 98.3%, a difference of 0.10%.
Kindergarten Correlation Summary
| Measurement | Immigrants from North America | Immigrants from Australia |
| Minimum | 93.6% | 93.4% |
| Maximum | 100.0% | 100.0% |
| Range | 6.4% | 6.6% |
| Mean | 99.0% | 99.1% |
| Median | 99.4% | 99.4% |
| Interquartile 25% (IQ1) | 98.8% | 98.7% |
| Interquartile 75% (IQ3) | 100.0% | 100.0% |
| Interquartile Range (IQR) | 1.2% | 1.3% |
| Standard Deviation (Sample) | 1.5% | 1.3% |
| Standard Deviation (Population) | 1.5% | 1.3% |
Similar Demographics by Kindergarten
Demographics Similar to Immigrants from North America by Kindergarten
In terms of kindergarten, the demographic groups most similar to Immigrants from North America are Immigrants from Canada (98.4%, a difference of 0.0%), Creek (98.4%, a difference of 0.0%), Slavic (98.4%, a difference of 0.0%), New Zealander (98.4%, a difference of 0.0%), and Greek (98.4%, a difference of 0.0%).
| Demographics | Rating | Rank | Kindergarten |
| Americans | 99.8 /100 | #56 | Exceptional 98.4% |
| Austrians | 99.8 /100 | #57 | Exceptional 98.4% |
| Bulgarians | 99.7 /100 | #58 | Exceptional 98.4% |
| Immigrants | Canada | 99.7 /100 | #59 | Exceptional 98.4% |
| Creek | 99.7 /100 | #60 | Exceptional 98.4% |
| Slavs | 99.7 /100 | #61 | Exceptional 98.4% |
| New Zealanders | 99.7 /100 | #62 | Exceptional 98.4% |
| Immigrants | North America | 99.7 /100 | #63 | Exceptional 98.4% |
| Greeks | 99.7 /100 | #64 | Exceptional 98.4% |
| Maltese | 99.7 /100 | #65 | Exceptional 98.4% |
| Cheyenne | 99.6 /100 | #66 | Exceptional 98.4% |
| Canadians | 99.6 /100 | #67 | Exceptional 98.4% |
| Immigrants | Northern Europe | 99.6 /100 | #68 | Exceptional 98.4% |
| Immigrants | Austria | 99.6 /100 | #69 | Exceptional 98.4% |
| Russians | 99.6 /100 | #70 | Exceptional 98.4% |
Demographics Similar to Immigrants from Australia by Kindergarten
In terms of kindergarten, the demographic groups most similar to Immigrants from Australia are Hopi (98.3%, a difference of 0.0%), Osage (98.3%, a difference of 0.010%), Immigrants from Denmark (98.3%, a difference of 0.010%), Immigrants from Sweden (98.3%, a difference of 0.010%), and Ukrainian (98.3%, a difference of 0.010%).
| Demographics | Rating | Rank | Kindergarten |
| Immigrants | Lithuania | 99.2 /100 | #80 | Exceptional 98.3% |
| Icelanders | 99.2 /100 | #81 | Exceptional 98.3% |
| Potawatomi | 99.2 /100 | #82 | Exceptional 98.3% |
| Osage | 99.1 /100 | #83 | Exceptional 98.3% |
| Immigrants | Denmark | 99.1 /100 | #84 | Exceptional 98.3% |
| Immigrants | Sweden | 99.1 /100 | #85 | Exceptional 98.3% |
| Hopi | 99.0 /100 | #86 | Exceptional 98.3% |
| Immigrants | Australia | 99.0 /100 | #87 | Exceptional 98.3% |
| Ukrainians | 98.8 /100 | #88 | Exceptional 98.3% |
| Immigrants | South Africa | 98.8 /100 | #89 | Exceptional 98.3% |
| Zimbabweans | 98.8 /100 | #90 | Exceptional 98.3% |
| Immigrants | Western Europe | 98.8 /100 | #91 | Exceptional 98.3% |
| Macedonians | 98.7 /100 | #92 | Exceptional 98.3% |
| Immigrants | India | 98.6 /100 | #93 | Exceptional 98.3% |
| South Africans | 98.5 /100 | #94 | Exceptional 98.3% |