Immigrants from North America vs Hispanic or Latino Kindergarten
COMPARE
Immigrants from North America
Hispanic or Latino
Kindergarten
Kindergarten Comparison
Immigrants from North America
Hispanics or Latinos
98.4%
KINDERGARTEN
99.7/ 100
METRIC RATING
63rd/ 347
METRIC RANK
97.0%
KINDERGARTEN
0.0/ 100
METRIC RATING
307th/ 347
METRIC RANK
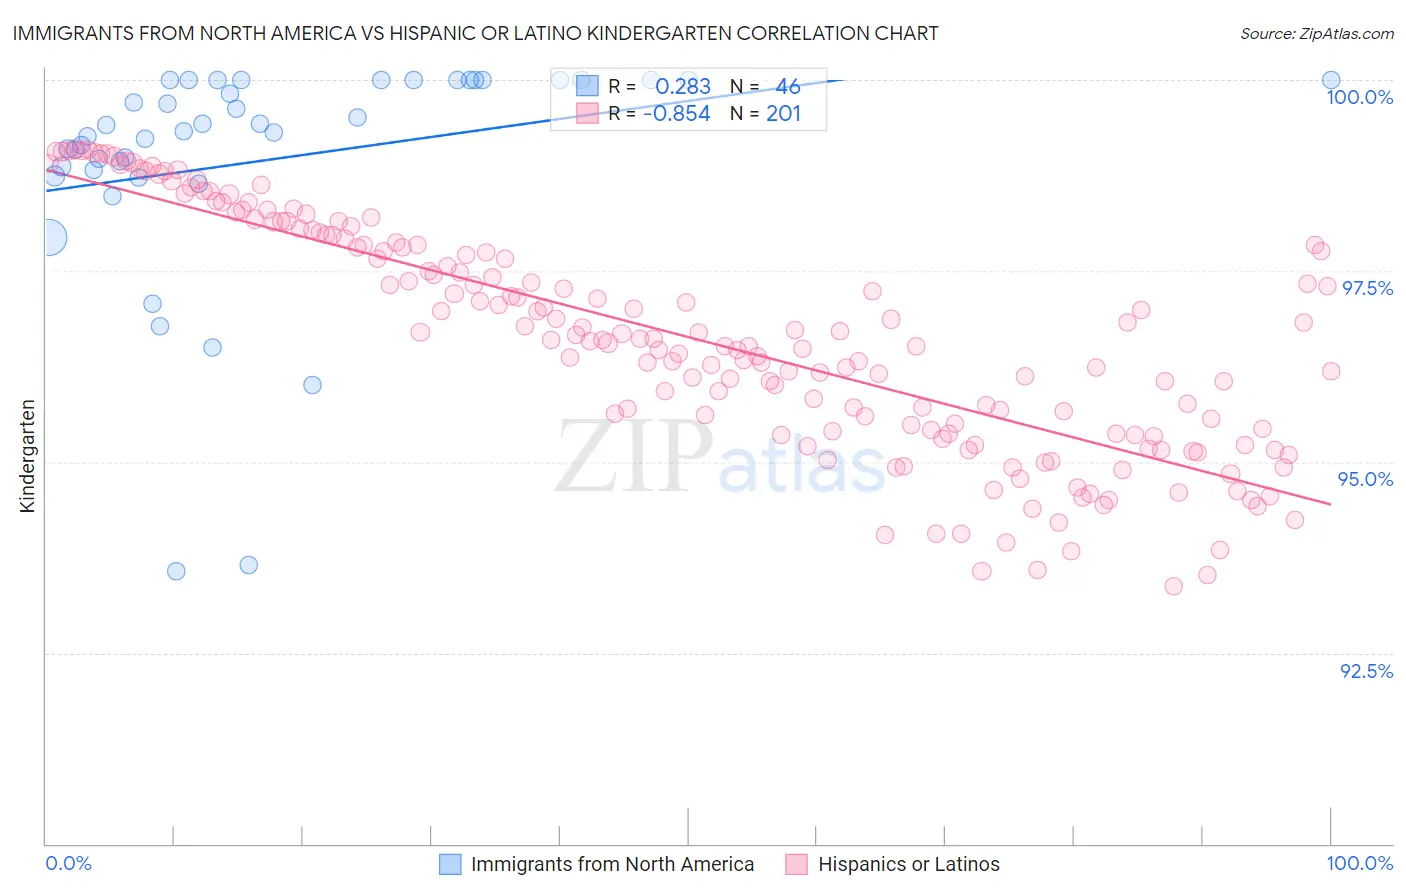
Immigrants from North America vs Hispanic or Latino Kindergarten Correlation Chart
The statistical analysis conducted on geographies consisting of 462,462,400 people shows a weak positive correlation between the proportion of Immigrants from North America and percentage of population with at least kindergarten education in the United States with a correlation coefficient (R) of 0.283 and weighted average of 98.4%. Similarly, the statistical analysis conducted on geographies consisting of 578,615,396 people shows a very strong negative correlation between the proportion of Hispanics or Latinos and percentage of population with at least kindergarten education in the United States with a correlation coefficient (R) of -0.854 and weighted average of 97.0%, a difference of 1.5%.
Kindergarten Correlation Summary
| Measurement | Immigrants from North America | Hispanic or Latino |
| Minimum | 93.6% | 93.4% |
| Maximum | 100.0% | 99.1% |
| Range | 6.4% | 5.7% |
| Mean | 99.0% | 96.6% |
| Median | 99.4% | 96.6% |
| Interquartile 25% (IQ1) | 98.8% | 95.4% |
| Interquartile 75% (IQ3) | 100.0% | 97.9% |
| Interquartile Range (IQR) | 1.2% | 2.5% |
| Standard Deviation (Sample) | 1.5% | 1.5% |
| Standard Deviation (Population) | 1.5% | 1.5% |
Similar Demographics by Kindergarten
Demographics Similar to Immigrants from North America by Kindergarten
In terms of kindergarten, the demographic groups most similar to Immigrants from North America are Immigrants from Canada (98.4%, a difference of 0.0%), Creek (98.4%, a difference of 0.0%), Slavic (98.4%, a difference of 0.0%), New Zealander (98.4%, a difference of 0.0%), and Greek (98.4%, a difference of 0.0%).
| Demographics | Rating | Rank | Kindergarten |
| Americans | 99.8 /100 | #56 | Exceptional 98.4% |
| Austrians | 99.8 /100 | #57 | Exceptional 98.4% |
| Bulgarians | 99.7 /100 | #58 | Exceptional 98.4% |
| Immigrants | Canada | 99.7 /100 | #59 | Exceptional 98.4% |
| Creek | 99.7 /100 | #60 | Exceptional 98.4% |
| Slavs | 99.7 /100 | #61 | Exceptional 98.4% |
| New Zealanders | 99.7 /100 | #62 | Exceptional 98.4% |
| Immigrants | North America | 99.7 /100 | #63 | Exceptional 98.4% |
| Greeks | 99.7 /100 | #64 | Exceptional 98.4% |
| Maltese | 99.7 /100 | #65 | Exceptional 98.4% |
| Cheyenne | 99.6 /100 | #66 | Exceptional 98.4% |
| Canadians | 99.6 /100 | #67 | Exceptional 98.4% |
| Immigrants | Northern Europe | 99.6 /100 | #68 | Exceptional 98.4% |
| Immigrants | Austria | 99.6 /100 | #69 | Exceptional 98.4% |
| Russians | 99.6 /100 | #70 | Exceptional 98.4% |
Demographics Similar to Hispanics or Latinos by Kindergarten
In terms of kindergarten, the demographic groups most similar to Hispanics or Latinos are Belizean (97.0%, a difference of 0.010%), Immigrants from Somalia (97.0%, a difference of 0.010%), Immigrants from Haiti (97.0%, a difference of 0.010%), Immigrants from the Azores (97.0%, a difference of 0.020%), and Sri Lankan (97.0%, a difference of 0.020%).
| Demographics | Rating | Rank | Kindergarten |
| Haitians | 0.0 /100 | #300 | Tragic 97.1% |
| Immigrants | South Eastern Asia | 0.0 /100 | #301 | Tragic 97.1% |
| Immigrants | Caribbean | 0.0 /100 | #302 | Tragic 97.1% |
| Somalis | 0.0 /100 | #303 | Tragic 97.0% |
| Nicaraguans | 0.0 /100 | #304 | Tragic 97.0% |
| Ecuadorians | 0.0 /100 | #305 | Tragic 97.0% |
| Belizeans | 0.0 /100 | #306 | Tragic 97.0% |
| Hispanics or Latinos | 0.0 /100 | #307 | Tragic 97.0% |
| Immigrants | Somalia | 0.0 /100 | #308 | Tragic 97.0% |
| Immigrants | Haiti | 0.0 /100 | #309 | Tragic 97.0% |
| Immigrants | Azores | 0.0 /100 | #310 | Tragic 97.0% |
| Sri Lankans | 0.0 /100 | #311 | Tragic 97.0% |
| Guyanese | 0.0 /100 | #312 | Tragic 96.9% |
| Cape Verdeans | 0.0 /100 | #313 | Tragic 96.9% |
| Hondurans | 0.0 /100 | #314 | Tragic 96.9% |