Immigrants from North America vs Cherokee In Labor Force | Age 25-29
COMPARE
Immigrants from North America
Cherokee
In Labor Force | Age 25-29
In Labor Force | Age 25-29 Comparison
Immigrants from North America
Cherokee
84.8%
IN LABOR FORCE | AGE 25-29
72.1/ 100
METRIC RATING
140th/ 347
METRIC RANK
82.1%
IN LABOR FORCE | AGE 25-29
0.0/ 100
METRIC RATING
314th/ 347
METRIC RANK
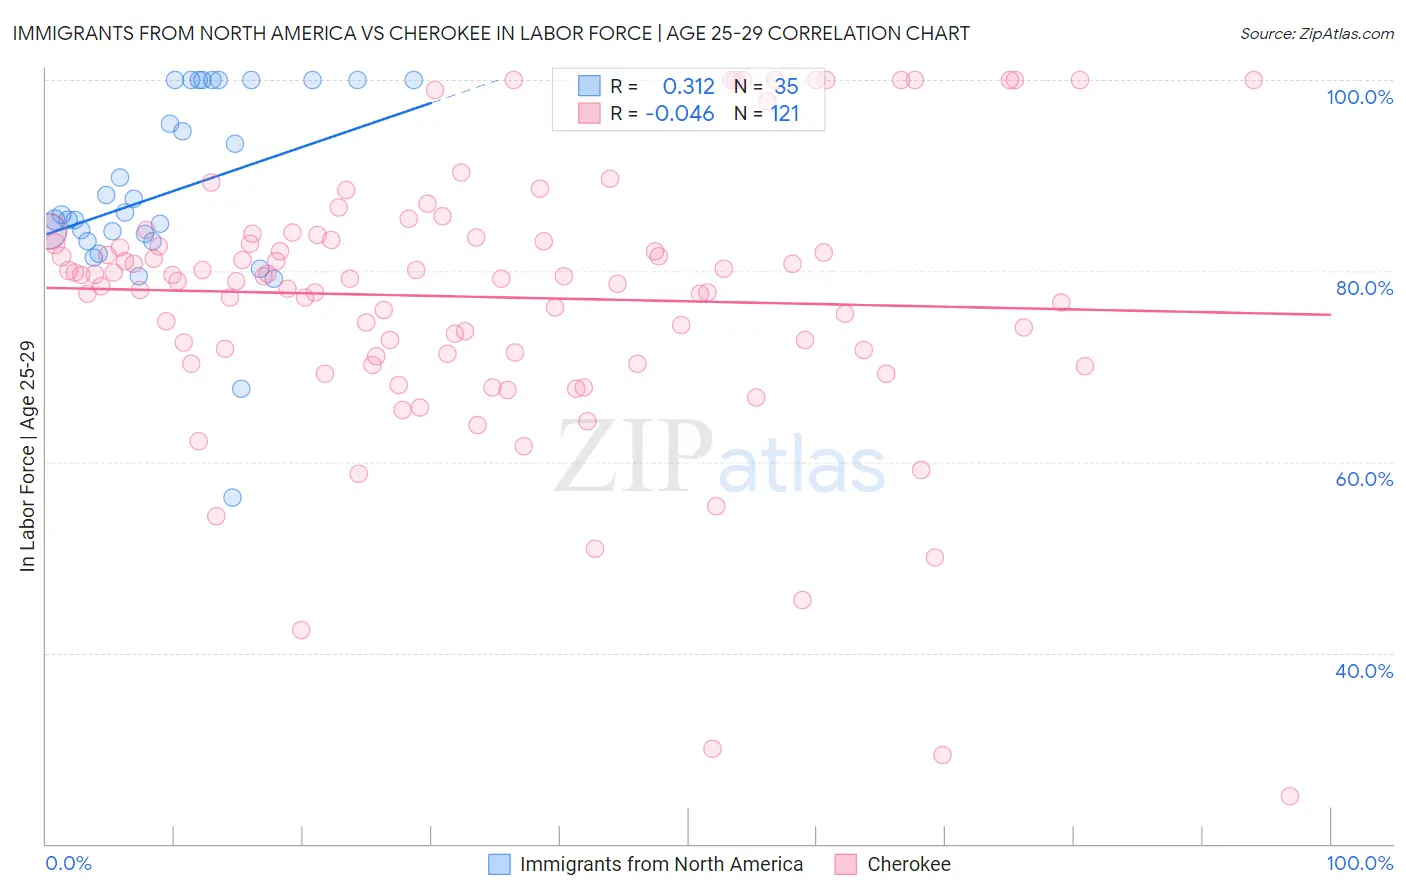
Immigrants from North America vs Cherokee In Labor Force | Age 25-29 Correlation Chart
The statistical analysis conducted on geographies consisting of 462,119,191 people shows a mild positive correlation between the proportion of Immigrants from North America and labor force participation rate among population between the ages 25 and 29 in the United States with a correlation coefficient (R) of 0.312 and weighted average of 84.8%. Similarly, the statistical analysis conducted on geographies consisting of 493,231,210 people shows no correlation between the proportion of Cherokee and labor force participation rate among population between the ages 25 and 29 in the United States with a correlation coefficient (R) of -0.046 and weighted average of 82.1%, a difference of 3.3%.
In Labor Force | Age 25-29 Correlation Summary
| Measurement | Immigrants from North America | Cherokee |
| Minimum | 56.3% | 25.0% |
| Maximum | 100.0% | 100.0% |
| Range | 43.7% | 75.0% |
| Mean | 88.3% | 77.3% |
| Median | 85.9% | 79.1% |
| Interquartile 25% (IQ1) | 83.2% | 71.2% |
| Interquartile 75% (IQ3) | 100.0% | 83.4% |
| Interquartile Range (IQR) | 16.8% | 12.2% |
| Standard Deviation (Sample) | 10.0% | 14.2% |
| Standard Deviation (Population) | 9.9% | 14.2% |
Similar Demographics by In Labor Force | Age 25-29
Demographics Similar to Immigrants from North America by In Labor Force | Age 25-29
In terms of in labor force | age 25-29, the demographic groups most similar to Immigrants from North America are Immigrants from Eastern Asia (84.8%, a difference of 0.0%), Danish (84.8%, a difference of 0.0%), Immigrants from Canada (84.8%, a difference of 0.010%), Armenian (84.8%, a difference of 0.010%), and Pakistani (84.8%, a difference of 0.020%).
| Demographics | Rating | Rank | In Labor Force | Age 25-29 |
| Asians | 77.7 /100 | #133 | Good 84.8% |
| Syrians | 76.5 /100 | #134 | Good 84.8% |
| Immigrants | Hungary | 76.4 /100 | #135 | Good 84.8% |
| Bhutanese | 76.0 /100 | #136 | Good 84.8% |
| Immigrants | Canada | 73.5 /100 | #137 | Good 84.8% |
| Armenians | 72.7 /100 | #138 | Good 84.8% |
| Immigrants | Eastern Asia | 72.6 /100 | #139 | Good 84.8% |
| Immigrants | North America | 72.1 /100 | #140 | Good 84.8% |
| Danes | 71.9 /100 | #141 | Good 84.8% |
| Pakistanis | 70.0 /100 | #142 | Good 84.8% |
| Sri Lankans | 69.2 /100 | #143 | Good 84.8% |
| Immigrants | Laos | 69.0 /100 | #144 | Good 84.8% |
| Immigrants | Senegal | 68.3 /100 | #145 | Good 84.8% |
| Icelanders | 68.2 /100 | #146 | Good 84.8% |
| Immigrants | Asia | 68.2 /100 | #147 | Good 84.8% |
Demographics Similar to Cherokee by In Labor Force | Age 25-29
In terms of in labor force | age 25-29, the demographic groups most similar to Cherokee are Yaqui (82.2%, a difference of 0.050%), Immigrants from Mexico (82.0%, a difference of 0.13%), Hispanic or Latino (82.2%, a difference of 0.14%), Alaskan Athabascan (82.3%, a difference of 0.21%), and Osage (82.3%, a difference of 0.22%).
| Demographics | Rating | Rank | In Labor Force | Age 25-29 |
| Cajuns | 0.0 /100 | #307 | Tragic 82.5% |
| Central American Indians | 0.0 /100 | #308 | Tragic 82.4% |
| Immigrants | Central America | 0.0 /100 | #309 | Tragic 82.4% |
| Osage | 0.0 /100 | #310 | Tragic 82.3% |
| Alaskan Athabascans | 0.0 /100 | #311 | Tragic 82.3% |
| Hispanics or Latinos | 0.0 /100 | #312 | Tragic 82.2% |
| Yaqui | 0.0 /100 | #313 | Tragic 82.2% |
| Cherokee | 0.0 /100 | #314 | Tragic 82.1% |
| Immigrants | Mexico | 0.0 /100 | #315 | Tragic 82.0% |
| Mexicans | 0.0 /100 | #316 | Tragic 81.9% |
| Chickasaw | 0.0 /100 | #317 | Tragic 81.9% |
| Comanche | 0.0 /100 | #318 | Tragic 81.9% |
| Seminole | 0.0 /100 | #319 | Tragic 81.7% |
| Colville | 0.0 /100 | #320 | Tragic 81.6% |
| Shoshone | 0.0 /100 | #321 | Tragic 81.6% |