Paiute vs Immigrants from Ghana 4th Grade

COMPARE

Paiute
Race
Ancestry
AfghanAfricanAlaska NativeAlaskan AthabascanAlbanianAleutAlsatianAmericanApacheArabArapahoArgentineanArmenianAssyrian/Chaldean/SyriacAustralianAustrianBahamianBangladeshiBarbadianBasqueBelgianBelizeanBermudanBhutaneseBlackfeetBolivianBrazilianBritishBritish West IndianBulgarianBurmeseCajunCambodianCanadianCape VerdeanCarpatho RusynCelticCentral AmericanCentral American IndianCherokeeCheyenneChickasawChileanChineseChippewaChoctawColombianColvilleComancheCosta RicanCreeCreekCroatianCrowCubanCypriotCzechCzechoslovakianDanishDelawareDominicanDutchDutch West IndianEastern EuropeanEcuadorianEgyptianEnglishEstonianEthiopianEuropeanFijianFilipinoFinnishFrenchFrench American IndianFrench CanadianGermanGerman RussianGhanaianGreekGuamanian/ChamorroGuatemalanGuyaneseHaitianHmongHonduranHopiHoumaHungarianIcelanderIndian (Asian)IndonesianInupiatIranianIraqiIrishIroquoisIsraeliItalianJamaicanJapaneseJordanianKenyanKiowaKoreanLaotianLatvianLebaneseLiberianLithuanianLumbeeLuxembourgerMacedonianMalaysianMalteseMarshalleseMenomineeMexicanMexican American IndianMongolianMoroccanNative HawaiianNavajoNepaleseNew ZealanderNicaraguanNigerianNorthern EuropeanNorwegianOkinawanOsageOttawaPaiutePakistaniPalestinianPanamanianParaguayanPennsylvania GermanPeruvianPimaPolishPortuguesePotawatomiPuebloPuerto RicanPuget Sound SalishRomanianRussianSalvadoranSamoanScandinavianScotch-IrishScottishSeminoleSenegaleseSerbianShoshoneSierra LeoneanSiouxSlavicSlovakSloveneSomaliSouth AfricanSouth AmericanSouth American IndianSoviet UnionSpaniardSpanishSpanish AmericanSpanish American IndianSri LankanSubsaharan AfricanSudaneseSwedishSwissSyrianTaiwaneseThaiTlingit-HaidaTohono O'OdhamTonganTrinidadian and TobagonianTsimshianTurkishU.S. Virgin IslanderUgandanUkrainianUruguayanUteVenezuelanVietnameseWelshWest IndianYakamaYaquiYugoslavianYumanYup'ikZimbabwean
Immigration
NonimmigrantsImmigrantsAfghanistanAfricaAlbaniaArgentinaArmeniaAsiaAustraliaAustriaBahamasBangladeshBarbadosBelarusBelgiumBelizeBoliviaBosnia and HerzegovinaBrazilBulgariaBurma/MyanmarCabo VerdeCambodiaCameroonCanadaCaribbeanCentral AmericaChileChinaColombiaCongoCosta RicaCroatiaCubaCzechoslovakiaDenmarkDominicaDominican RepublicEastern AfricaEastern AsiaEastern EuropeEcuadorEgyptEl SalvadorEnglandEritreaEthiopiaEuropeFijiFranceGermanyGreeceGrenadaGuatemalaGuyanaHaitiHondurasHong KongHungaryIndiaIndonesiaIranIraqIrelandIsraelItalyJamaicaJapanJordanKazakhstanKenyaKoreaKuwaitLaosLatin AmericaLatviaLebanonLiberiaLithuaniaMalaysiaMexicoMicronesiaMiddle AfricaMoldovaMoroccoNepalNetherlandsNicaraguaNigeriaNorth AmericaNorth MacedoniaNorthern AfricaNorthern EuropeNorwayOceaniaPakistanPanamaPeruPhilippinesPolandPortugalRomaniaRussiaSaudi ArabiaScotlandSenegalSerbiaSierra LeoneSingaporeSomaliaSouth AfricaSouth AmericaSouth Central AsiaSouth Eastern AsiaSouthern EuropeSpainSri LankaSt. Vincent and the GrenadinesSudanSwedenSwitzerlandSyriaTaiwanThailandTrinidad and TobagoTurkeyUgandaUkraineUruguayUzbekistanVenezuelaVietnamWest IndiesWestern AfricaWestern AsiaWestern EuropeYemenZaireZimbabweAzores
Immigrants from Ghana
Race
Ancestry
AfghanAfricanAlaska NativeAlaskan AthabascanAlbanianAleutAlsatianAmericanApacheArabArapahoArgentineanArmenianAssyrian/Chaldean/SyriacAustralianAustrianBahamianBangladeshiBarbadianBasqueBelgianBelizeanBermudanBhutaneseBlackfeetBolivianBrazilianBritishBritish West IndianBulgarianBurmeseCajunCambodianCanadianCape VerdeanCarpatho RusynCelticCentral AmericanCentral American IndianCherokeeCheyenneChickasawChileanChineseChippewaChoctawColombianColvilleComancheCosta RicanCreeCreekCroatianCrowCubanCypriotCzechCzechoslovakianDanishDelawareDominicanDutchDutch West IndianEastern EuropeanEcuadorianEgyptianEnglishEstonianEthiopianEuropeanFijianFilipinoFinnishFrenchFrench American IndianFrench CanadianGermanGerman RussianGhanaianGreekGuamanian/ChamorroGuatemalanGuyaneseHaitianHmongHonduranHopiHoumaHungarianIcelanderIndian (Asian)IndonesianInupiatIranianIraqiIrishIroquoisIsraeliItalianJamaicanJapaneseJordanianKenyanKiowaKoreanLaotianLatvianLebaneseLiberianLithuanianLumbeeLuxembourgerMacedonianMalaysianMalteseMarshalleseMenomineeMexicanMexican American IndianMongolianMoroccanNative HawaiianNavajoNepaleseNew ZealanderNicaraguanNigerianNorthern EuropeanNorwegianOkinawanOsageOttawaPakistaniPalestinianPanamanianParaguayanPennsylvania GermanPeruvianPimaPolishPortuguesePotawatomiPuebloPuerto RicanPuget Sound SalishRomanianRussianSalvadoranSamoanScandinavianScotch-IrishScottishSeminoleSenegaleseSerbianShoshoneSierra LeoneanSiouxSlavicSlovakSloveneSomaliSouth AfricanSouth AmericanSouth American IndianSoviet UnionSpaniardSpanishSpanish AmericanSpanish American IndianSri LankanSubsaharan AfricanSudaneseSwedishSwissSyrianTaiwaneseThaiTlingit-HaidaTohono O'OdhamTonganTrinidadian and TobagonianTsimshianTurkishU.S. Virgin IslanderUgandanUkrainianUruguayanUteVenezuelanVietnameseWelshWest IndianYakamaYaquiYugoslavianYumanYup'ikZimbabwean
Immigration
NonimmigrantsImmigrantsAfghanistanAfricaAlbaniaArgentinaArmeniaAsiaAustraliaAustriaBahamasBangladeshBarbadosBelarusBelgiumBelizeBoliviaBosnia and HerzegovinaBrazilBulgariaBurma/MyanmarCabo VerdeCambodiaCameroonCanadaCaribbeanCentral AmericaChileChinaColombiaCongoCosta RicaCroatiaCubaCzechoslovakiaDenmarkDominicaDominican RepublicEastern AfricaEastern AsiaEastern EuropeEcuadorEgyptEl SalvadorEnglandEritreaEthiopiaEuropeFijiFranceGermanyGhanaGreeceGrenadaGuatemalaGuyanaHaitiHondurasHong KongHungaryIndiaIndonesiaIranIraqIrelandIsraelItalyJamaicaJapanJordanKazakhstanKenyaKoreaKuwaitLaosLatin AmericaLatviaLebanonLiberiaLithuaniaMalaysiaMexicoMicronesiaMiddle AfricaMoldovaMoroccoNepalNetherlandsNicaraguaNigeriaNorth AmericaNorth MacedoniaNorthern AfricaNorthern EuropeNorwayOceaniaPakistanPanamaPeruPhilippinesPolandPortugalRomaniaRussiaSaudi ArabiaScotlandSenegalSerbiaSierra LeoneSingaporeSomaliaSouth AfricaSouth AmericaSouth Central AsiaSouth Eastern AsiaSouthern EuropeSpainSri LankaSt. Vincent and the GrenadinesSudanSwedenSwitzerlandSyriaTaiwanThailandTrinidad and TobagoTurkeyUgandaUkraineUruguayUzbekistanVenezuelaVietnamWest IndiesWestern AfricaWestern AsiaWestern EuropeYemenZaireZimbabweAzores
4th Grade
Income
Poverty
Unemployment
Labor Participation
Family Structure
Vehicle Availability
Education Level
Disability

4th Grade Comparison

Paiute

Immigrants from Ghana

Poor
Tragic
97.3%
4TH GRADE
13.2/ 100
METRIC RATING
205th/ 347
METRIC RANK
96.9%
4TH GRADE
0.1/ 100
METRIC RATING
275th/ 347
METRIC RANK

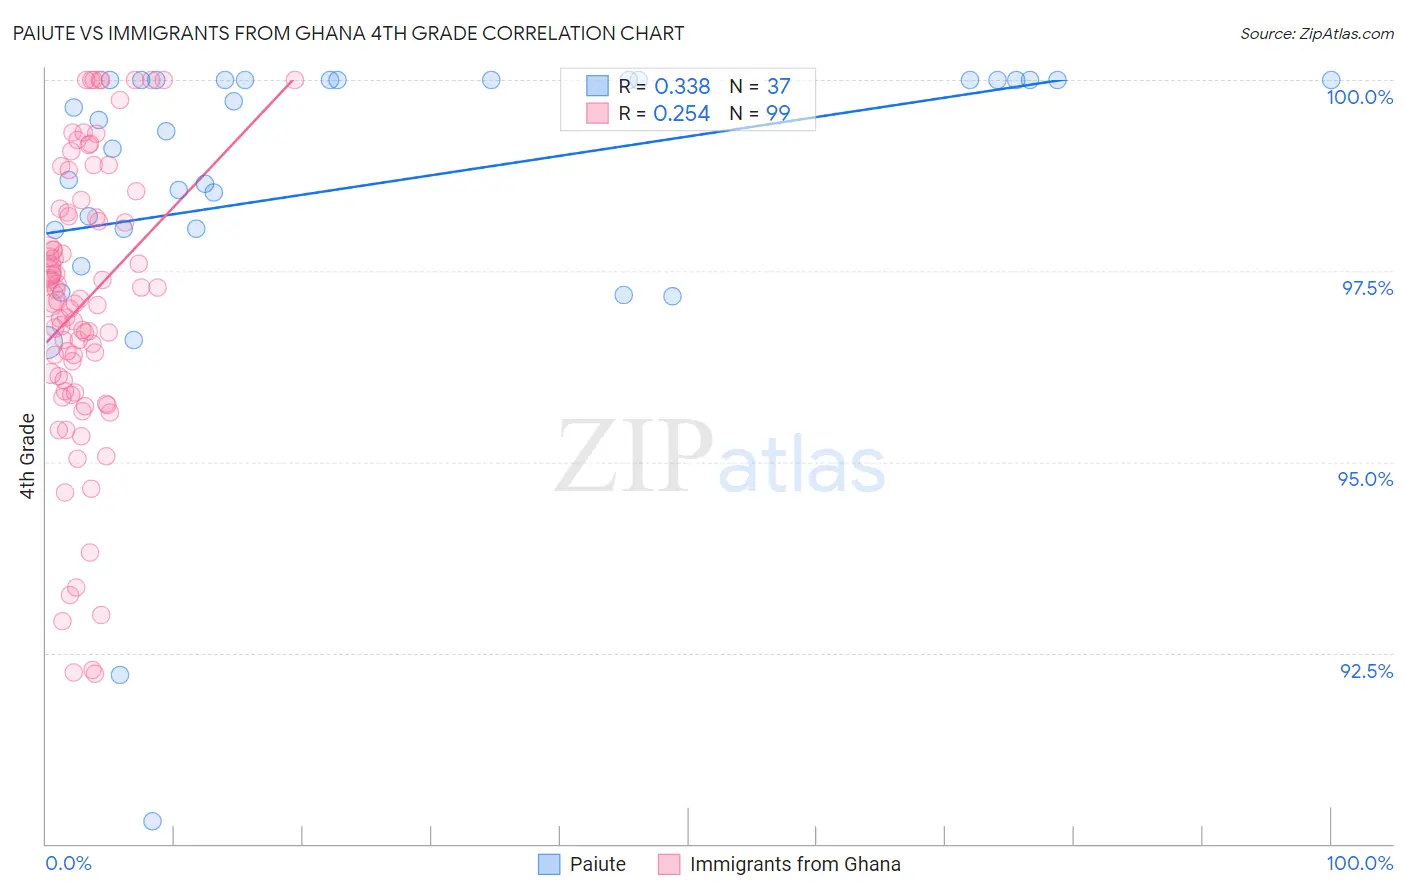
Paiute vs Immigrants from Ghana 4th Grade Correlation Chart

The statistical analysis conducted on geographies consisting of 58,402,332 people shows a mild positive correlation between the proportion of Paiute and percentage of population with at least 4th grade education in the United States with a correlation coefficient (R) of 0.338 and weighted average of 97.3%. Similarly, the statistical analysis conducted on geographies consisting of 199,952,023 people shows a weak positive correlation between the proportion of Immigrants from Ghana and percentage of population with at least 4th grade education in the United States with a correlation coefficient (R) of 0.254 and weighted average of 96.9%, a difference of 0.47%.
Paiute vs Immigrants from Ghana 4th Grade

4th Grade Correlation Summary

MeasurementPaiuteImmigrants from Ghana
Minimum90.3%92.2%
Maximum100.0%100.0%
Range9.7%7.8%
Mean98.6%97.1%
Median99.5%97.1%
Interquartile 25% (IQ1)98.0%96.1%
Interquartile 75% (IQ3)100.0%98.3%
Interquartile Range (IQR)2.0%2.2%
Standard Deviation (Sample)2.1%1.9%
Standard Deviation (Population)2.1%1.8%

Similar Demographics by 4th Grade

Demographics Similar to Paiute by 4th Grade

In terms of 4th grade, the demographic groups most similar to Paiute are Immigrants from Zaire (97.3%, a difference of 0.0%), Immigrants from Northern Africa (97.4%, a difference of 0.010%), African (97.4%, a difference of 0.010%), Immigrants from Southern Europe (97.4%, a difference of 0.020%), and Immigrants from Chile (97.4%, a difference of 0.020%).
DemographicsRating | Rank4th Grade
Guamanians/Chamorros
23.0
/100
|
#198
Fair
97.4%
Natives/Alaskans
20.6
/100
|
#199
Fair
97.4%
Immigrants | Uganda
19.8
/100
|
#200
Poor
97.4%
Immigrants | Southern Europe
16.2
/100
|
#201
Poor
97.4%
Immigrants | Chile
16.1
/100
|
#202
Poor
97.4%
Immigrants | Northern Africa
15.1
/100
|
#203
Poor
97.4%
Africans
14.6
/100
|
#204
Poor
97.4%
Paiute
13.2
/100
|
#205
Poor
97.3%
Immigrants | Zaire
12.8
/100
|
#206
Poor
97.3%
Moroccans
11.3
/100
|
#207
Poor
97.3%
Immigrants | Bahamas
10.8
/100
|
#208
Poor
97.3%
Laotians
9.3
/100
|
#209
Tragic
97.3%
Immigrants | Oceania
9.1
/100
|
#210
Tragic
97.3%
Sudanese
9.0
/100
|
#211
Tragic
97.3%
Tohono O'odham
8.4
/100
|
#212
Tragic
97.3%

Demographics Similar to Immigrants from Ghana by 4th Grade

In terms of 4th grade, the demographic groups most similar to Immigrants from Ghana are Yaqui (96.9%, a difference of 0.0%), Trinidadian and Tobagonian (96.9%, a difference of 0.010%), Immigrants from Western Africa (96.9%, a difference of 0.010%), Immigrants from Bolivia (96.9%, a difference of 0.010%), and Immigrants from Peru (96.9%, a difference of 0.020%).
DemographicsRating | Rank4th Grade
Ghanaians
0.2
/100
|
#268
Tragic
97.0%
Immigrants | Uzbekistan
0.2
/100
|
#269
Tragic
96.9%
Cubans
0.2
/100
|
#270
Tragic
96.9%
Immigrants | Peru
0.1
/100
|
#271
Tragic
96.9%
Fijians
0.1
/100
|
#272
Tragic
96.9%
Immigrants | Cameroon
0.1
/100
|
#273
Tragic
96.9%
Trinidadians and Tobagonians
0.1
/100
|
#274
Tragic
96.9%
Immigrants | Ghana
0.1
/100
|
#275
Tragic
96.9%
Yaqui
0.1
/100
|
#276
Tragic
96.9%
Immigrants | Western Africa
0.1
/100
|
#277
Tragic
96.9%
Immigrants | Bolivia
0.1
/100
|
#278
Tragic
96.9%
Afghans
0.1
/100
|
#279
Tragic
96.9%
Barbadians
0.1
/100
|
#280
Tragic
96.9%
Immigrants | Hong Kong
0.1
/100
|
#281
Tragic
96.9%
Immigrants | Trinidad and Tobago
0.1
/100
|
#282
Tragic
96.8%