Albanian vs Immigrants from Ghana 4th Grade
COMPARE
Albanian
Immigrants from Ghana
4th Grade
4th Grade Comparison
Albanians
Immigrants from Ghana
97.6%
4TH GRADE
67.0/ 100
METRIC RATING
155th/ 347
METRIC RANK
96.9%
4TH GRADE
0.1/ 100
METRIC RATING
275th/ 347
METRIC RANK
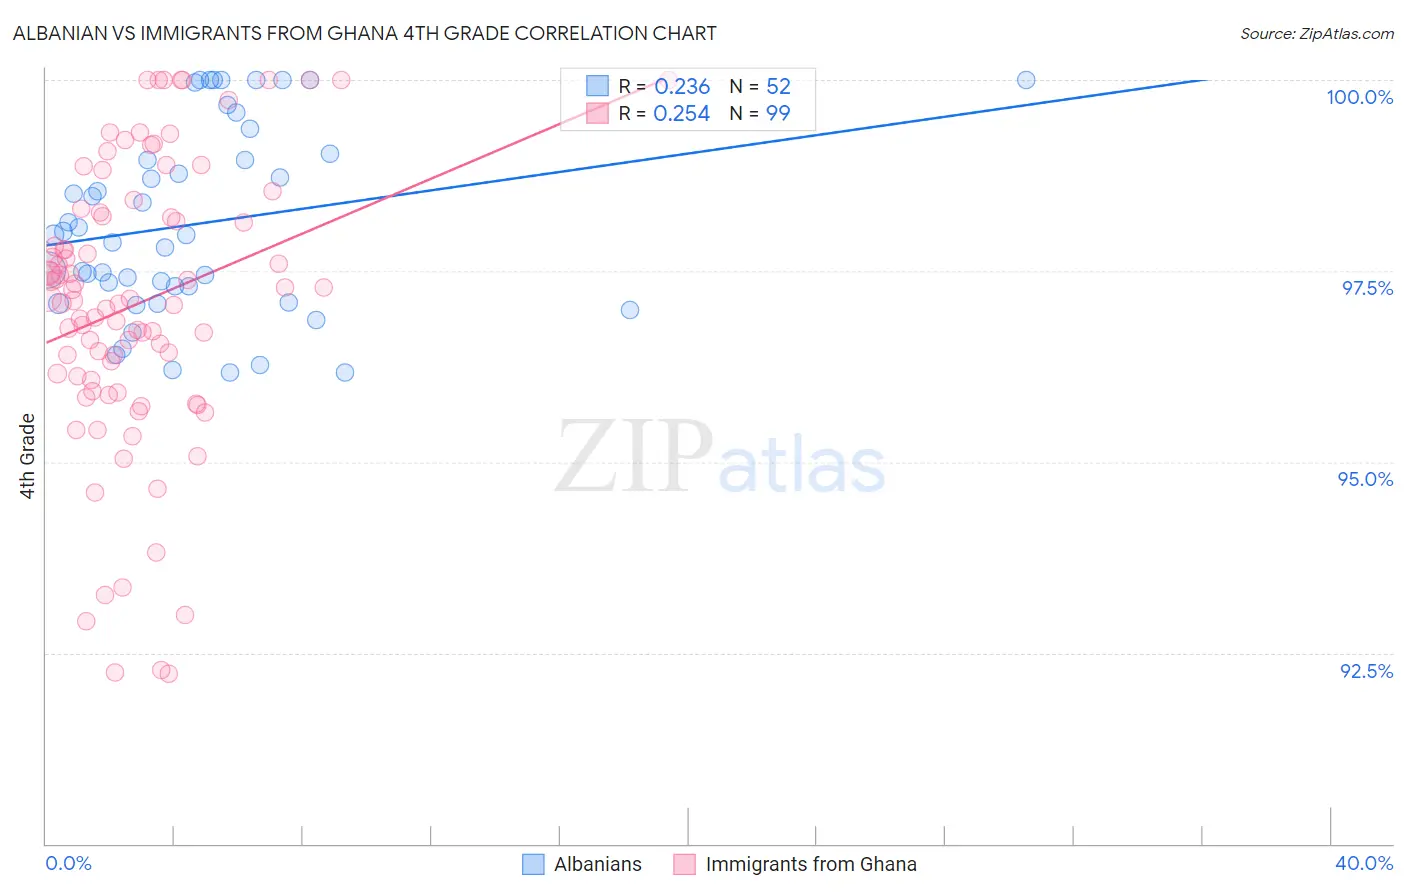
Albanian vs Immigrants from Ghana 4th Grade Correlation Chart
The statistical analysis conducted on geographies consisting of 193,265,850 people shows a weak positive correlation between the proportion of Albanians and percentage of population with at least 4th grade education in the United States with a correlation coefficient (R) of 0.236 and weighted average of 97.6%. Similarly, the statistical analysis conducted on geographies consisting of 199,952,023 people shows a weak positive correlation between the proportion of Immigrants from Ghana and percentage of population with at least 4th grade education in the United States with a correlation coefficient (R) of 0.254 and weighted average of 96.9%, a difference of 0.72%.
4th Grade Correlation Summary
| Measurement | Albanian | Immigrants from Ghana |
| Minimum | 96.2% | 92.2% |
| Maximum | 100.0% | 100.0% |
| Range | 3.8% | 7.8% |
| Mean | 98.1% | 97.1% |
| Median | 98.0% | 97.1% |
| Interquartile 25% (IQ1) | 97.2% | 96.1% |
| Interquartile 75% (IQ3) | 99.0% | 98.3% |
| Interquartile Range (IQR) | 1.8% | 2.2% |
| Standard Deviation (Sample) | 1.2% | 1.9% |
| Standard Deviation (Population) | 1.2% | 1.8% |
Similar Demographics by 4th Grade
Demographics Similar to Albanians by 4th Grade
In terms of 4th grade, the demographic groups most similar to Albanians are Immigrants from Russia (97.6%, a difference of 0.0%), Immigrants from Jordan (97.6%, a difference of 0.0%), Immigrants from Bosnia and Herzegovina (97.6%, a difference of 0.0%), French American Indian (97.6%, a difference of 0.0%), and Immigrants from Italy (97.6%, a difference of 0.010%).
| Demographics | Rating | Rank | 4th Grade |
| Hopi | 80.6 /100 | #148 | Excellent 97.7% |
| Soviet Union | 77.8 /100 | #149 | Good 97.6% |
| Immigrants | Israel | 77.7 /100 | #150 | Good 97.6% |
| Alsatians | 77.2 /100 | #151 | Good 97.6% |
| Immigrants | South Central Asia | 76.2 /100 | #152 | Good 97.6% |
| Immigrants | Eastern Europe | 71.3 /100 | #153 | Good 97.6% |
| Immigrants | Russia | 67.0 /100 | #154 | Good 97.6% |
| Albanians | 67.0 /100 | #155 | Good 97.6% |
| Immigrants | Jordan | 66.9 /100 | #156 | Good 97.6% |
| Immigrants | Bosnia and Herzegovina | 66.0 /100 | #157 | Good 97.6% |
| French American Indians | 65.9 /100 | #158 | Good 97.6% |
| Immigrants | Italy | 63.7 /100 | #159 | Good 97.6% |
| Apache | 61.3 /100 | #160 | Good 97.6% |
| Marshallese | 60.8 /100 | #161 | Good 97.6% |
| Bermudans | 60.5 /100 | #162 | Good 97.6% |
Demographics Similar to Immigrants from Ghana by 4th Grade
In terms of 4th grade, the demographic groups most similar to Immigrants from Ghana are Yaqui (96.9%, a difference of 0.0%), Trinidadian and Tobagonian (96.9%, a difference of 0.010%), Immigrants from Western Africa (96.9%, a difference of 0.010%), Immigrants from Bolivia (96.9%, a difference of 0.010%), and Immigrants from Peru (96.9%, a difference of 0.020%).
| Demographics | Rating | Rank | 4th Grade |
| Ghanaians | 0.2 /100 | #268 | Tragic 97.0% |
| Immigrants | Uzbekistan | 0.2 /100 | #269 | Tragic 96.9% |
| Cubans | 0.2 /100 | #270 | Tragic 96.9% |
| Immigrants | Peru | 0.1 /100 | #271 | Tragic 96.9% |
| Fijians | 0.1 /100 | #272 | Tragic 96.9% |
| Immigrants | Cameroon | 0.1 /100 | #273 | Tragic 96.9% |
| Trinidadians and Tobagonians | 0.1 /100 | #274 | Tragic 96.9% |
| Immigrants | Ghana | 0.1 /100 | #275 | Tragic 96.9% |
| Yaqui | 0.1 /100 | #276 | Tragic 96.9% |
| Immigrants | Western Africa | 0.1 /100 | #277 | Tragic 96.9% |
| Immigrants | Bolivia | 0.1 /100 | #278 | Tragic 96.9% |
| Afghans | 0.1 /100 | #279 | Tragic 96.9% |
| Barbadians | 0.1 /100 | #280 | Tragic 96.9% |
| Immigrants | Hong Kong | 0.1 /100 | #281 | Tragic 96.9% |
| Immigrants | Trinidad and Tobago | 0.1 /100 | #282 | Tragic 96.8% |