Immigrants from Ecuador vs Immigrants from Denmark 6th Grade
COMPARE
Immigrants from Ecuador
Immigrants from Denmark
6th Grade
6th Grade Comparison
Immigrants from Ecuador
Immigrants from Denmark
95.3%
6TH GRADE
0.0/ 100
METRIC RATING
320th/ 347
METRIC RANK
97.5%
6TH GRADE
98.5/ 100
METRIC RATING
98th/ 347
METRIC RANK
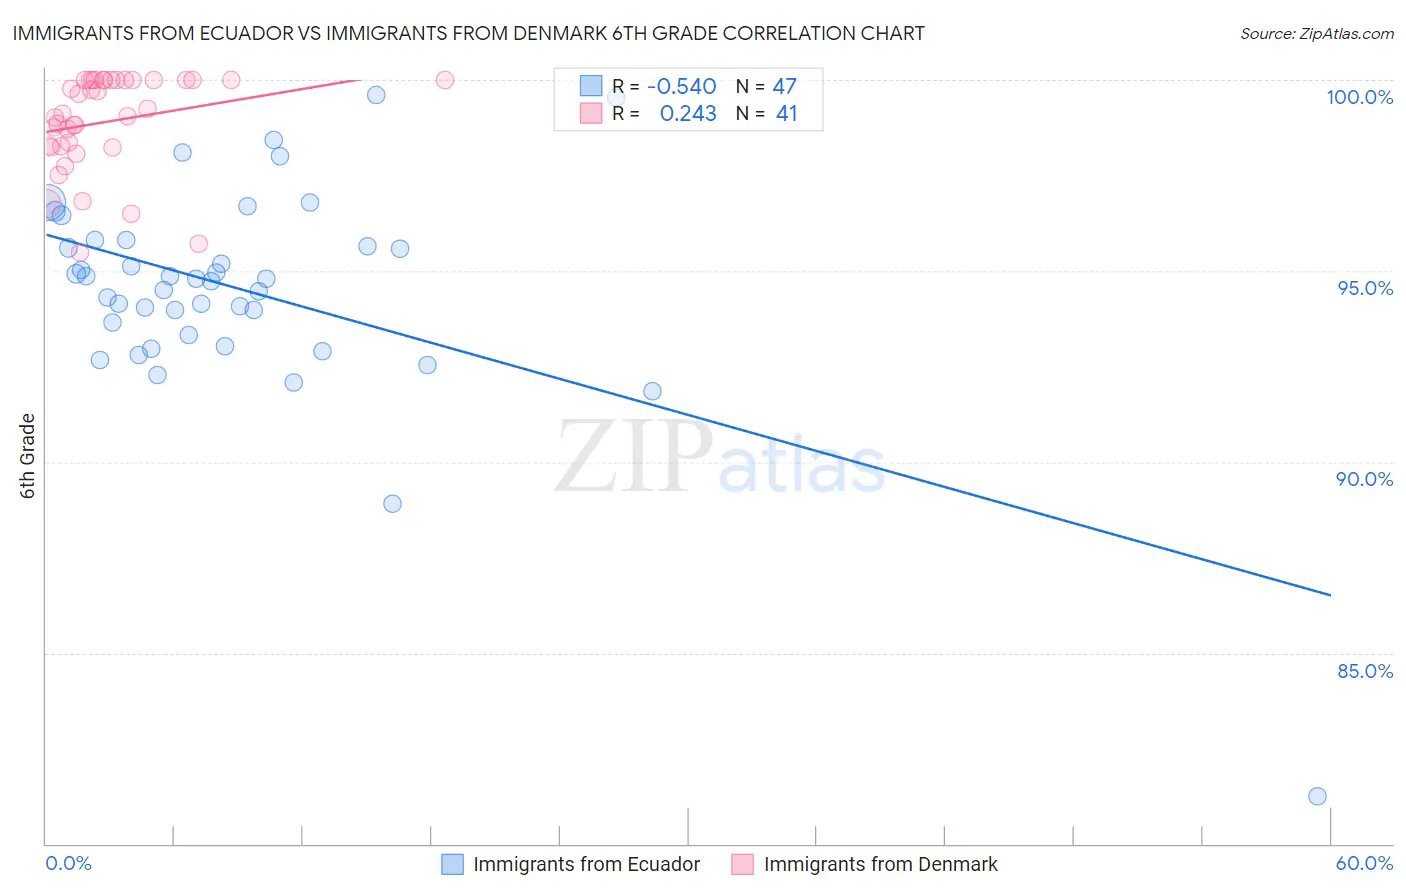
Immigrants from Ecuador vs Immigrants from Denmark 6th Grade Correlation Chart
The statistical analysis conducted on geographies consisting of 271,020,679 people shows a substantial negative correlation between the proportion of Immigrants from Ecuador and percentage of population with at least 6th grade education in the United States with a correlation coefficient (R) of -0.540 and weighted average of 95.3%. Similarly, the statistical analysis conducted on geographies consisting of 136,430,932 people shows a weak positive correlation between the proportion of Immigrants from Denmark and percentage of population with at least 6th grade education in the United States with a correlation coefficient (R) of 0.243 and weighted average of 97.5%, a difference of 2.4%.
6th Grade Correlation Summary
| Measurement | Immigrants from Ecuador | Immigrants from Denmark |
| Minimum | 81.2% | 95.5% |
| Maximum | 99.6% | 100.0% |
| Range | 18.3% | 4.5% |
| Mean | 94.5% | 98.9% |
| Median | 94.8% | 99.1% |
| Interquartile 25% (IQ1) | 93.3% | 98.3% |
| Interquartile 75% (IQ3) | 95.8% | 100.0% |
| Interquartile Range (IQR) | 2.5% | 1.7% |
| Standard Deviation (Sample) | 2.8% | 1.3% |
| Standard Deviation (Population) | 2.8% | 1.2% |
Similar Demographics by 6th Grade
Demographics Similar to Immigrants from Ecuador by 6th Grade
In terms of 6th grade, the demographic groups most similar to Immigrants from Ecuador are Immigrants from Belize (95.3%, a difference of 0.030%), Belizean (95.3%, a difference of 0.040%), Vietnamese (95.3%, a difference of 0.060%), Immigrants from Fiji (95.2%, a difference of 0.060%), and Japanese (95.4%, a difference of 0.10%).
| Demographics | Rating | Rank | 6th Grade |
| Nicaraguans | 0.0 /100 | #313 | Tragic 95.4% |
| Immigrants | Vietnam | 0.0 /100 | #314 | Tragic 95.4% |
| Immigrants | Bangladesh | 0.0 /100 | #315 | Tragic 95.4% |
| Japanese | 0.0 /100 | #316 | Tragic 95.4% |
| Vietnamese | 0.0 /100 | #317 | Tragic 95.3% |
| Belizeans | 0.0 /100 | #318 | Tragic 95.3% |
| Immigrants | Belize | 0.0 /100 | #319 | Tragic 95.3% |
| Immigrants | Ecuador | 0.0 /100 | #320 | Tragic 95.3% |
| Immigrants | Fiji | 0.0 /100 | #321 | Tragic 95.2% |
| Immigrants | Cambodia | 0.0 /100 | #322 | Tragic 95.2% |
| Central American Indians | 0.0 /100 | #323 | Tragic 95.1% |
| Cape Verdeans | 0.0 /100 | #324 | Tragic 95.1% |
| Immigrants | Nicaragua | 0.0 /100 | #325 | Tragic 95.1% |
| Hispanics or Latinos | 0.0 /100 | #326 | Tragic 95.0% |
| Mexican American Indians | 0.0 /100 | #327 | Tragic 95.0% |
Demographics Similar to Immigrants from Denmark by 6th Grade
In terms of 6th grade, the demographic groups most similar to Immigrants from Denmark are Yugoslavian (97.5%, a difference of 0.0%), Romanian (97.5%, a difference of 0.010%), Cree (97.5%, a difference of 0.010%), Cypriot (97.5%, a difference of 0.010%), and Immigrants from Ireland (97.5%, a difference of 0.010%).
| Demographics | Rating | Rank | 6th Grade |
| Immigrants | Western Europe | 98.8 /100 | #91 | Exceptional 97.5% |
| Romanians | 98.7 /100 | #92 | Exceptional 97.5% |
| Cree | 98.7 /100 | #93 | Exceptional 97.5% |
| Cypriots | 98.7 /100 | #94 | Exceptional 97.5% |
| Immigrants | Ireland | 98.7 /100 | #95 | Exceptional 97.5% |
| Immigrants | Germany | 98.6 /100 | #96 | Exceptional 97.5% |
| Immigrants | Sweden | 98.6 /100 | #97 | Exceptional 97.5% |
| Immigrants | Denmark | 98.5 /100 | #98 | Exceptional 97.5% |
| Yugoslavians | 98.5 /100 | #99 | Exceptional 97.5% |
| Turks | 98.3 /100 | #100 | Exceptional 97.5% |
| South Africans | 98.2 /100 | #101 | Exceptional 97.5% |
| Choctaw | 98.0 /100 | #102 | Exceptional 97.5% |
| Bhutanese | 98.0 /100 | #103 | Exceptional 97.5% |
| German Russians | 97.9 /100 | #104 | Exceptional 97.5% |
| Cheyenne | 97.9 /100 | #105 | Exceptional 97.5% |