Immigrants from Nicaragua vs Filipino Master's Degree
COMPARE
Immigrants from Nicaragua
Filipino
Master's Degree
Master's Degree Comparison
Immigrants from Nicaragua
Filipinos
11.8%
MASTER'S DEGREE
0.2/ 100
METRIC RATING
285th/ 347
METRIC RANK
23.4%
MASTER'S DEGREE
100.0/ 100
METRIC RATING
2nd/ 347
METRIC RANK
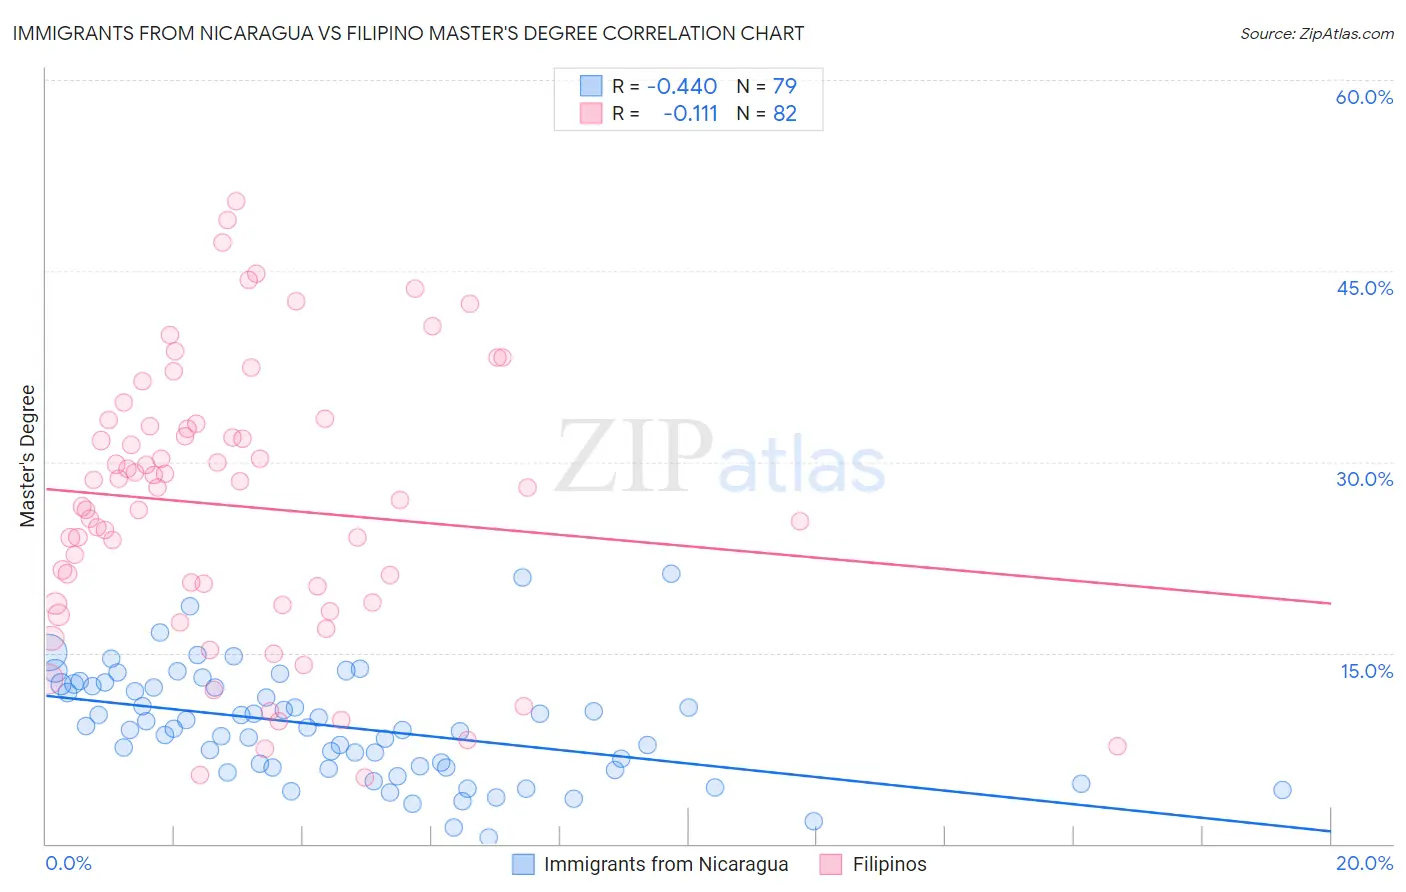
Immigrants from Nicaragua vs Filipino Master's Degree Correlation Chart
The statistical analysis conducted on geographies consisting of 236,327,248 people shows a moderate negative correlation between the proportion of Immigrants from Nicaragua and percentage of population with at least master's degree education in the United States with a correlation coefficient (R) of -0.440 and weighted average of 11.8%. Similarly, the statistical analysis conducted on geographies consisting of 254,302,816 people shows a poor negative correlation between the proportion of Filipinos and percentage of population with at least master's degree education in the United States with a correlation coefficient (R) of -0.111 and weighted average of 23.4%, a difference of 97.7%.
Master's Degree Correlation Summary
| Measurement | Immigrants from Nicaragua | Filipino |
| Minimum | 0.53% | 5.2% |
| Maximum | 21.2% | 50.5% |
| Range | 20.7% | 45.2% |
| Mean | 9.2% | 26.5% |
| Median | 9.1% | 27.5% |
| Interquartile 25% (IQ1) | 6.0% | 18.8% |
| Interquartile 75% (IQ3) | 12.4% | 32.8% |
| Interquartile Range (IQR) | 6.4% | 14.0% |
| Standard Deviation (Sample) | 4.3% | 10.7% |
| Standard Deviation (Population) | 4.3% | 10.6% |
Similar Demographics by Master's Degree
Demographics Similar to Immigrants from Nicaragua by Master's Degree
In terms of master's degree, the demographic groups most similar to Immigrants from Nicaragua are Ottawa (11.9%, a difference of 0.18%), Aleut (11.8%, a difference of 0.35%), Immigrants from Haiti (11.8%, a difference of 0.55%), Immigrants from Honduras (11.8%, a difference of 0.72%), and Guatemalan (11.7%, a difference of 0.80%).
| Demographics | Rating | Rank | Master's Degree |
| Potawatomi | 0.3 /100 | #278 | Tragic 12.1% |
| Immigrants | Belize | 0.2 /100 | #279 | Tragic 12.1% |
| Immigrants | Dominican Republic | 0.2 /100 | #280 | Tragic 12.1% |
| Malaysians | 0.2 /100 | #281 | Tragic 12.0% |
| Immigrants | El Salvador | 0.2 /100 | #282 | Tragic 12.0% |
| Hondurans | 0.2 /100 | #283 | Tragic 11.9% |
| Ottawa | 0.2 /100 | #284 | Tragic 11.9% |
| Immigrants | Nicaragua | 0.2 /100 | #285 | Tragic 11.8% |
| Aleuts | 0.1 /100 | #286 | Tragic 11.8% |
| Immigrants | Haiti | 0.1 /100 | #287 | Tragic 11.8% |
| Immigrants | Honduras | 0.1 /100 | #288 | Tragic 11.8% |
| Guatemalans | 0.1 /100 | #289 | Tragic 11.7% |
| Ute | 0.1 /100 | #290 | Tragic 11.7% |
| Colville | 0.1 /100 | #291 | Tragic 11.6% |
| Immigrants | Guatemala | 0.1 /100 | #292 | Tragic 11.6% |
Demographics Similar to Filipinos by Master's Degree
In terms of master's degree, the demographic groups most similar to Filipinos are Immigrants from Singapore (23.4%, a difference of 0.050%), Immigrants from Israel (22.6%, a difference of 3.4%), Okinawan (22.6%, a difference of 3.4%), Immigrants from Taiwan (22.5%, a difference of 4.2%), and Immigrants from India (22.3%, a difference of 4.9%).
| Demographics | Rating | Rank | Master's Degree |
| Immigrants | Singapore | 100.0 /100 | #1 | Exceptional 23.4% |
| Filipinos | 100.0 /100 | #2 | Exceptional 23.4% |
| Immigrants | Israel | 100.0 /100 | #3 | Exceptional 22.6% |
| Okinawans | 100.0 /100 | #4 | Exceptional 22.6% |
| Immigrants | Taiwan | 100.0 /100 | #5 | Exceptional 22.5% |
| Immigrants | India | 100.0 /100 | #6 | Exceptional 22.3% |
| Iranians | 100.0 /100 | #7 | Exceptional 22.3% |
| Cypriots | 100.0 /100 | #8 | Exceptional 21.8% |
| Thais | 100.0 /100 | #9 | Exceptional 21.7% |
| Immigrants | Iran | 100.0 /100 | #10 | Exceptional 21.6% |
| Immigrants | China | 100.0 /100 | #11 | Exceptional 21.2% |
| Eastern Europeans | 100.0 /100 | #12 | Exceptional 21.1% |
| Immigrants | Australia | 100.0 /100 | #13 | Exceptional 20.9% |
| Immigrants | Switzerland | 100.0 /100 | #14 | Exceptional 20.9% |
| Immigrants | Eastern Asia | 100.0 /100 | #15 | Exceptional 20.8% |