Immigrants from Nicaragua vs Filipino 2nd Grade
COMPARE
Immigrants from Nicaragua
Filipino
2nd Grade
2nd Grade Comparison
Immigrants from Nicaragua
Filipinos
96.7%
2ND GRADE
0.0/ 100
METRIC RATING
319th/ 347
METRIC RANK
98.0%
2ND GRADE
79.2/ 100
METRIC RATING
145th/ 347
METRIC RANK
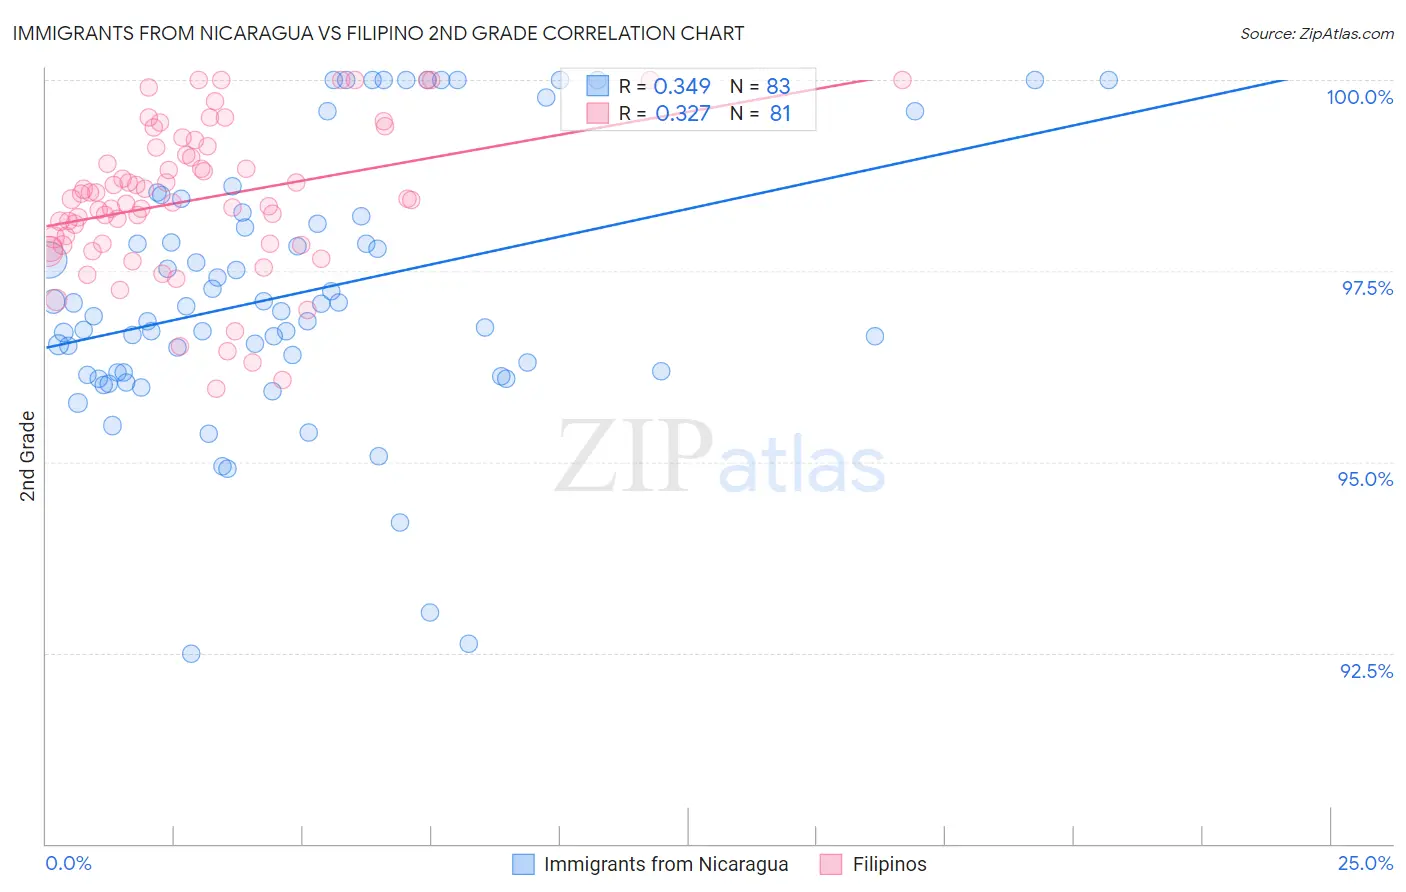
Immigrants from Nicaragua vs Filipino 2nd Grade Correlation Chart
The statistical analysis conducted on geographies consisting of 236,332,861 people shows a mild positive correlation between the proportion of Immigrants from Nicaragua and percentage of population with at least 2nd grade education in the United States with a correlation coefficient (R) of 0.349 and weighted average of 96.7%. Similarly, the statistical analysis conducted on geographies consisting of 254,351,427 people shows a mild positive correlation between the proportion of Filipinos and percentage of population with at least 2nd grade education in the United States with a correlation coefficient (R) of 0.327 and weighted average of 98.0%, a difference of 1.3%.
2nd Grade Correlation Summary
| Measurement | Immigrants from Nicaragua | Filipino |
| Minimum | 92.5% | 95.9% |
| Maximum | 100.0% | 100.0% |
| Range | 7.5% | 4.1% |
| Mean | 97.2% | 98.4% |
| Median | 97.0% | 98.4% |
| Interquartile 25% (IQ1) | 96.2% | 97.8% |
| Interquartile 75% (IQ3) | 98.2% | 99.1% |
| Interquartile Range (IQR) | 2.0% | 1.3% |
| Standard Deviation (Sample) | 1.7% | 0.97% |
| Standard Deviation (Population) | 1.7% | 0.97% |
Similar Demographics by 2nd Grade
Demographics Similar to Immigrants from Nicaragua by 2nd Grade
In terms of 2nd grade, the demographic groups most similar to Immigrants from Nicaragua are Immigrants from Laos (96.7%, a difference of 0.0%), Indonesian (96.7%, a difference of 0.0%), Immigrants from Belize (96.8%, a difference of 0.010%), Honduran (96.7%, a difference of 0.010%), and Immigrants from Guyana (96.7%, a difference of 0.010%).
| Demographics | Rating | Rank | 2nd Grade |
| Cape Verdeans | 0.0 /100 | #312 | Tragic 96.8% |
| Hispanics or Latinos | 0.0 /100 | #313 | Tragic 96.8% |
| Immigrants | Ecuador | 0.0 /100 | #314 | Tragic 96.8% |
| Immigrants | Belize | 0.0 /100 | #315 | Tragic 96.8% |
| Hondurans | 0.0 /100 | #316 | Tragic 96.7% |
| Immigrants | Laos | 0.0 /100 | #317 | Tragic 96.7% |
| Indonesians | 0.0 /100 | #318 | Tragic 96.7% |
| Immigrants | Nicaragua | 0.0 /100 | #319 | Tragic 96.7% |
| Immigrants | Guyana | 0.0 /100 | #320 | Tragic 96.7% |
| Immigrants | Burma/Myanmar | 0.0 /100 | #321 | Tragic 96.7% |
| Immigrants | Bangladesh | 0.0 /100 | #322 | Tragic 96.7% |
| Vietnamese | 0.0 /100 | #323 | Tragic 96.7% |
| Mexican American Indians | 0.0 /100 | #324 | Tragic 96.7% |
| Dominicans | 0.0 /100 | #325 | Tragic 96.6% |
| Immigrants | Honduras | 0.0 /100 | #326 | Tragic 96.6% |
Demographics Similar to Filipinos by 2nd Grade
In terms of 2nd grade, the demographic groups most similar to Filipinos are Hmong (98.0%, a difference of 0.0%), Burmese (98.0%, a difference of 0.010%), Alsatian (98.0%, a difference of 0.010%), Immigrants from Israel (98.0%, a difference of 0.010%), and Immigrants from Greece (98.0%, a difference of 0.010%).
| Demographics | Rating | Rank | 2nd Grade |
| Israelis | 87.9 /100 | #138 | Excellent 98.0% |
| Blackfeet | 87.5 /100 | #139 | Excellent 98.0% |
| Palestinians | 83.9 /100 | #140 | Excellent 98.0% |
| Immigrants | Turkey | 83.0 /100 | #141 | Excellent 98.0% |
| Burmese | 81.0 /100 | #142 | Excellent 98.0% |
| Alsatians | 80.5 /100 | #143 | Excellent 98.0% |
| Hmong | 80.0 /100 | #144 | Good 98.0% |
| Filipinos | 79.2 /100 | #145 | Good 98.0% |
| Immigrants | Israel | 78.0 /100 | #146 | Good 98.0% |
| Immigrants | Greece | 76.8 /100 | #147 | Good 98.0% |
| Jordanians | 74.5 /100 | #148 | Good 98.0% |
| Apache | 74.0 /100 | #149 | Good 97.9% |
| Immigrants | Moldova | 72.9 /100 | #150 | Good 97.9% |
| Soviet Union | 70.7 /100 | #151 | Good 97.9% |
| Immigrants | North Macedonia | 68.5 /100 | #152 | Good 97.9% |