Spanish American vs Moroccan 12th Grade, No Diploma
COMPARE
Spanish American
Moroccan
12th Grade, No Diploma
12th Grade, No Diploma Comparison
Spanish Americans
Moroccans
89.9%
12TH GRADE, NO DIPLOMA
0.9/ 100
METRIC RATING
251st/ 347
METRIC RANK
90.9%
12TH GRADE, NO DIPLOMA
28.8/ 100
METRIC RATING
191st/ 347
METRIC RANK
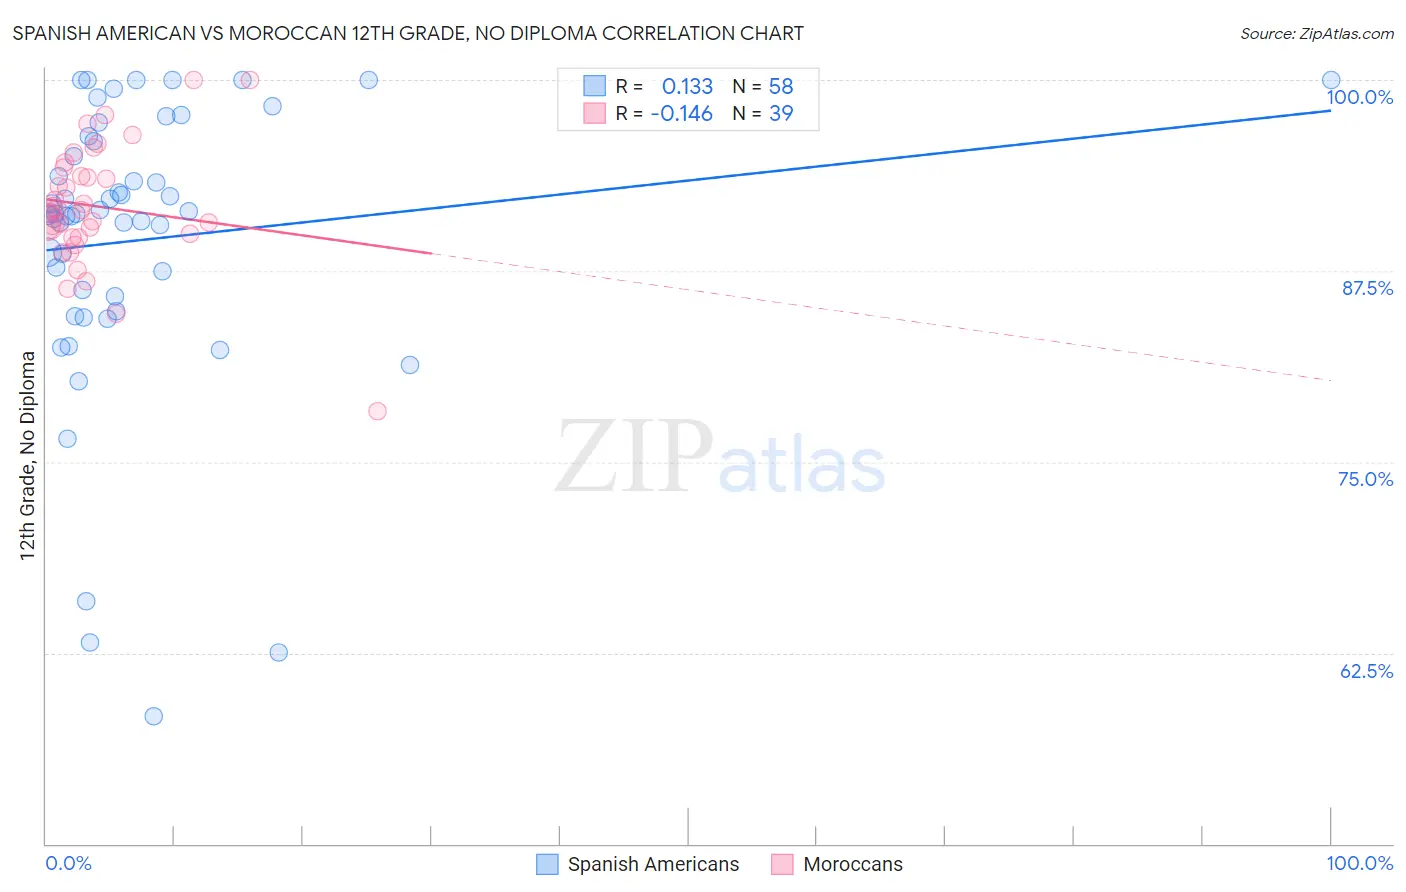
Spanish American vs Moroccan 12th Grade, No Diploma Correlation Chart
The statistical analysis conducted on geographies consisting of 103,166,592 people shows a poor positive correlation between the proportion of Spanish Americans and percentage of population with at least 12th grade (no diploma) education in the United States with a correlation coefficient (R) of 0.133 and weighted average of 89.9%. Similarly, the statistical analysis conducted on geographies consisting of 201,817,667 people shows a poor negative correlation between the proportion of Moroccans and percentage of population with at least 12th grade (no diploma) education in the United States with a correlation coefficient (R) of -0.146 and weighted average of 90.9%, a difference of 1.2%.
12th Grade, No Diploma Correlation Summary
| Measurement | Spanish American | Moroccan |
| Minimum | 58.3% | 78.3% |
| Maximum | 100.0% | 100.0% |
| Range | 41.7% | 21.7% |
| Mean | 89.5% | 91.7% |
| Median | 91.2% | 91.5% |
| Interquartile 25% (IQ1) | 85.8% | 89.7% |
| Interquartile 75% (IQ3) | 96.0% | 94.3% |
| Interquartile Range (IQR) | 10.1% | 4.6% |
| Standard Deviation (Sample) | 9.4% | 4.1% |
| Standard Deviation (Population) | 9.3% | 4.1% |
Similar Demographics by 12th Grade, No Diploma
Demographics Similar to Spanish Americans by 12th Grade, No Diploma
In terms of 12th grade, no diploma, the demographic groups most similar to Spanish Americans are Bahamian (89.9%, a difference of 0.0%), Immigrants from Eritrea (89.9%, a difference of 0.010%), Comanche (89.9%, a difference of 0.040%), Senegalese (89.9%, a difference of 0.040%), and Choctaw (89.8%, a difference of 0.090%).
| Demographics | Rating | Rank | 12th Grade, No Diploma |
| Taiwanese | 1.5 /100 | #244 | Tragic 90.0% |
| Immigrants | Uruguay | 1.4 /100 | #245 | Tragic 90.0% |
| Ghanaians | 1.3 /100 | #246 | Tragic 90.0% |
| Immigrants | Nigeria | 1.3 /100 | #247 | Tragic 89.9% |
| Comanche | 1.1 /100 | #248 | Tragic 89.9% |
| Senegalese | 1.1 /100 | #249 | Tragic 89.9% |
| Immigrants | Eritrea | 1.0 /100 | #250 | Tragic 89.9% |
| Spanish Americans | 0.9 /100 | #251 | Tragic 89.9% |
| Bahamians | 0.9 /100 | #252 | Tragic 89.9% |
| Choctaw | 0.7 /100 | #253 | Tragic 89.8% |
| Immigrants | Peru | 0.5 /100 | #254 | Tragic 89.7% |
| Immigrants | Senegal | 0.5 /100 | #255 | Tragic 89.7% |
| Immigrants | Ghana | 0.5 /100 | #256 | Tragic 89.7% |
| Jamaicans | 0.5 /100 | #257 | Tragic 89.7% |
| Africans | 0.4 /100 | #258 | Tragic 89.6% |
Demographics Similar to Moroccans by 12th Grade, No Diploma
In terms of 12th grade, no diploma, the demographic groups most similar to Moroccans are Afghan (90.9%, a difference of 0.010%), Immigrants from Eastern Africa (90.9%, a difference of 0.020%), Immigrants from Ethiopia (90.9%, a difference of 0.030%), Immigrants from Uganda (90.9%, a difference of 0.040%), and Immigrants from Oceania (90.9%, a difference of 0.040%).
| Demographics | Rating | Rank | 12th Grade, No Diploma |
| Spaniards | 36.2 /100 | #184 | Fair 91.0% |
| Sudanese | 34.4 /100 | #185 | Fair 91.0% |
| Ethiopians | 33.9 /100 | #186 | Fair 91.0% |
| Potawatomi | 32.9 /100 | #187 | Fair 91.0% |
| Americans | 32.6 /100 | #188 | Fair 91.0% |
| Immigrants | Uganda | 31.6 /100 | #189 | Fair 90.9% |
| Afghans | 29.9 /100 | #190 | Fair 90.9% |
| Moroccans | 28.8 /100 | #191 | Fair 90.9% |
| Immigrants | Eastern Africa | 27.7 /100 | #192 | Fair 90.9% |
| Immigrants | Ethiopia | 27.2 /100 | #193 | Fair 90.9% |
| Immigrants | Oceania | 26.0 /100 | #194 | Fair 90.9% |
| Koreans | 24.5 /100 | #195 | Fair 90.8% |
| Panamanians | 22.8 /100 | #196 | Fair 90.8% |
| Immigrants | Sudan | 22.6 /100 | #197 | Fair 90.8% |
| Samoans | 20.4 /100 | #198 | Fair 90.8% |