Immigrants from Ecuador vs Moroccan 12th Grade, No Diploma
COMPARE
Immigrants from Ecuador
Moroccan
12th Grade, No Diploma
12th Grade, No Diploma Comparison
Immigrants from Ecuador
Moroccans
87.5%
12TH GRADE, NO DIPLOMA
0.0/ 100
METRIC RATING
312th/ 347
METRIC RANK
90.9%
12TH GRADE, NO DIPLOMA
28.8/ 100
METRIC RATING
191st/ 347
METRIC RANK
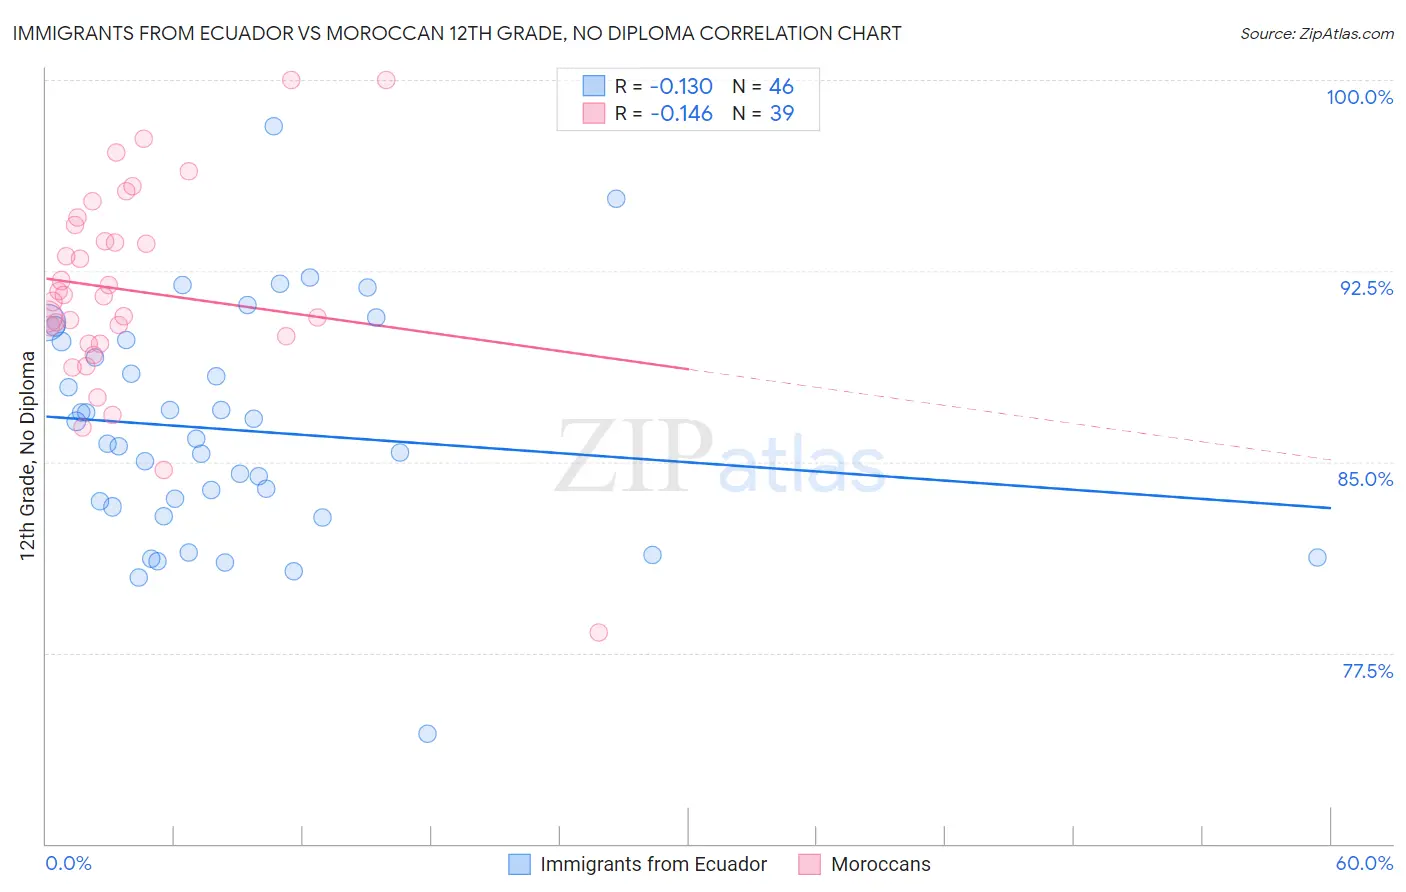
Immigrants from Ecuador vs Moroccan 12th Grade, No Diploma Correlation Chart
The statistical analysis conducted on geographies consisting of 270,907,929 people shows a poor negative correlation between the proportion of Immigrants from Ecuador and percentage of population with at least 12th grade (no diploma) education in the United States with a correlation coefficient (R) of -0.130 and weighted average of 87.5%. Similarly, the statistical analysis conducted on geographies consisting of 201,817,667 people shows a poor negative correlation between the proportion of Moroccans and percentage of population with at least 12th grade (no diploma) education in the United States with a correlation coefficient (R) of -0.146 and weighted average of 90.9%, a difference of 3.9%.
12th Grade, No Diploma Correlation Summary
| Measurement | Immigrants from Ecuador | Moroccan |
| Minimum | 74.3% | 78.3% |
| Maximum | 98.2% | 100.0% |
| Range | 23.9% | 21.7% |
| Mean | 86.2% | 91.7% |
| Median | 85.8% | 91.5% |
| Interquartile 25% (IQ1) | 83.2% | 89.7% |
| Interquartile 75% (IQ3) | 89.7% | 94.3% |
| Interquartile Range (IQR) | 6.5% | 4.6% |
| Standard Deviation (Sample) | 4.5% | 4.1% |
| Standard Deviation (Population) | 4.4% | 4.1% |
Similar Demographics by 12th Grade, No Diploma
Demographics Similar to Immigrants from Ecuador by 12th Grade, No Diploma
In terms of 12th grade, no diploma, the demographic groups most similar to Immigrants from Ecuador are Yaqui (87.5%, a difference of 0.0%), Immigrants from Cuba (87.5%, a difference of 0.050%), Immigrants from Armenia (87.6%, a difference of 0.10%), Immigrants from Caribbean (87.4%, a difference of 0.12%), and Yup'ik (87.6%, a difference of 0.13%).
| Demographics | Rating | Rank | 12th Grade, No Diploma |
| Immigrants | Dominica | 0.0 /100 | #305 | Tragic 87.7% |
| Natives/Alaskans | 0.0 /100 | #306 | Tragic 87.7% |
| Immigrants | Portugal | 0.0 /100 | #307 | Tragic 87.6% |
| Yup'ik | 0.0 /100 | #308 | Tragic 87.6% |
| Immigrants | Armenia | 0.0 /100 | #309 | Tragic 87.6% |
| Immigrants | Cuba | 0.0 /100 | #310 | Tragic 87.5% |
| Yaqui | 0.0 /100 | #311 | Tragic 87.5% |
| Immigrants | Ecuador | 0.0 /100 | #312 | Tragic 87.5% |
| Immigrants | Caribbean | 0.0 /100 | #313 | Tragic 87.4% |
| Cape Verdeans | 0.0 /100 | #314 | Tragic 87.4% |
| Nicaraguans | 0.0 /100 | #315 | Tragic 87.3% |
| Apache | 0.0 /100 | #316 | Tragic 87.3% |
| Navajo | 0.0 /100 | #317 | Tragic 87.1% |
| Belizeans | 0.0 /100 | #318 | Tragic 87.0% |
| Immigrants | Belize | 0.0 /100 | #319 | Tragic 87.0% |
Demographics Similar to Moroccans by 12th Grade, No Diploma
In terms of 12th grade, no diploma, the demographic groups most similar to Moroccans are Afghan (90.9%, a difference of 0.010%), Immigrants from Eastern Africa (90.9%, a difference of 0.020%), Immigrants from Ethiopia (90.9%, a difference of 0.030%), Immigrants from Uganda (90.9%, a difference of 0.040%), and Immigrants from Oceania (90.9%, a difference of 0.040%).
| Demographics | Rating | Rank | 12th Grade, No Diploma |
| Spaniards | 36.2 /100 | #184 | Fair 91.0% |
| Sudanese | 34.4 /100 | #185 | Fair 91.0% |
| Ethiopians | 33.9 /100 | #186 | Fair 91.0% |
| Potawatomi | 32.9 /100 | #187 | Fair 91.0% |
| Americans | 32.6 /100 | #188 | Fair 91.0% |
| Immigrants | Uganda | 31.6 /100 | #189 | Fair 90.9% |
| Afghans | 29.9 /100 | #190 | Fair 90.9% |
| Moroccans | 28.8 /100 | #191 | Fair 90.9% |
| Immigrants | Eastern Africa | 27.7 /100 | #192 | Fair 90.9% |
| Immigrants | Ethiopia | 27.2 /100 | #193 | Fair 90.9% |
| Immigrants | Oceania | 26.0 /100 | #194 | Fair 90.9% |
| Koreans | 24.5 /100 | #195 | Fair 90.8% |
| Panamanians | 22.8 /100 | #196 | Fair 90.8% |
| Immigrants | Sudan | 22.6 /100 | #197 | Fair 90.8% |
| Samoans | 20.4 /100 | #198 | Fair 90.8% |